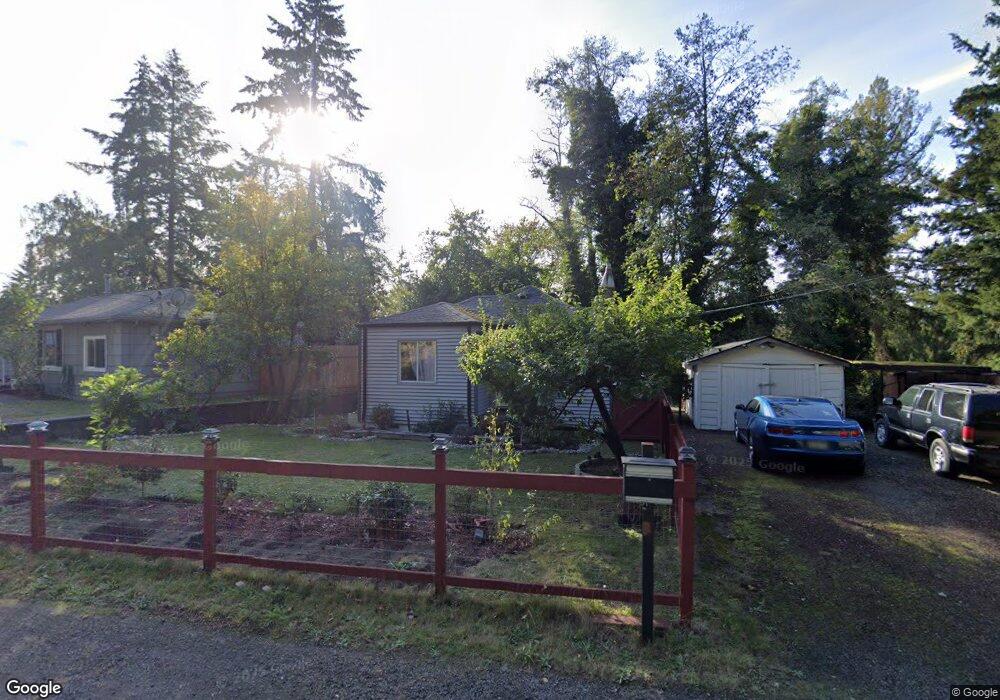
1811 Rocky Point Rd NW Bremerton, WA 98312
Estimated Value: $312,000 - $345,000
1
Bed
1
Bath
654
Sq Ft
$495/Sq Ft
Est. Value
About This Home
This home is located at 1811 Rocky Point Rd NW, Bremerton, WA 98312 and is currently estimated at $323,639, approximately $494 per square foot. 1811 Rocky Point Rd NW is a home located in Kitsap County with nearby schools including Crownhill Elementary School, Mountain View Middle School, and Bremerton High School.
Ownership History
Date
Name
Owned For
Owner Type
Purchase Details
Closed on
Nov 11, 2014
Sold by
Skurtu Divina D
Bought by
Skurtu Divina D and Skurtu Winona Dizon
Current Estimated Value
Home Financials for this Owner
Home Financials are based on the most recent Mortgage that was taken out on this home.
Original Mortgage
$95,550
Outstanding Balance
$72,265
Interest Rate
3.66%
Mortgage Type
New Conventional
Estimated Equity
$251,374
Purchase Details
Closed on
Dec 28, 2004
Sold by
Schneringer Jeff and Schneringer Tracey
Bought by
Skurtu Divina D
Home Financials for this Owner
Home Financials are based on the most recent Mortgage that was taken out on this home.
Original Mortgage
$122,000
Interest Rate
6.87%
Mortgage Type
Purchase Money Mortgage
Purchase Details
Closed on
Jul 26, 2004
Sold by
Santarini Don and Norwest Mortgage Inc
Bought by
Schneringer Jeff
Purchase Details
Closed on
Jun 15, 1995
Sold by
Simon Erich J and Simon Wanda
Bought by
Santarini Don
Home Financials for this Owner
Home Financials are based on the most recent Mortgage that was taken out on this home.
Original Mortgage
$54,060
Interest Rate
7.92%
Mortgage Type
Assumption
Create a Home Valuation Report for This Property
The Home Valuation Report is an in-depth analysis detailing your home's value as well as a comparison with similar homes in the area
Home Values in the Area
Average Home Value in this Area
Purchase History
| Date | Buyer | Sale Price | Title Company |
|---|---|---|---|
| Skurtu Divina D | -- | First American Title | |
| Skurtu Divina D | $122,000 | Pacific Nw Title | |
| Schneringer Jeff | $57,107 | -- | |
| Santarini Don | $53,000 | Charter Title Corp |
Source: Public Records
Mortgage History
| Date | Status | Borrower | Loan Amount |
|---|---|---|---|
| Open | Skurtu Divina D | $95,550 | |
| Closed | Skurtu Divina D | $122,000 | |
| Previous Owner | Santarini Don | $54,060 |
Source: Public Records
Tax History Compared to Growth
Tax History
| Year | Tax Paid | Tax Assessment Tax Assessment Total Assessment is a certain percentage of the fair market value that is determined by local assessors to be the total taxable value of land and additions on the property. | Land | Improvement |
|---|---|---|---|---|
| 2026 | $2,133 | $241,690 | $77,370 | $164,320 |
| 2025 | $2,133 | $241,690 | $77,370 | $164,320 |
| 2024 | $2,058 | $241,690 | $77,370 | $164,320 |
| 2023 | $2,127 | $241,690 | $77,370 | $164,320 |
| 2022 | $1,978 | $201,990 | $64,480 | $137,510 |
| 2021 | $1,612 | $150,650 | $48,480 | $102,170 |
| 2020 | $1,497 | $139,790 | $44,870 | $94,920 |
| 2019 | $1,297 | $125,490 | $40,390 | $85,100 |
| 2018 | $1,357 | $86,350 | $30,370 | $55,980 |
| 2017 | $1,132 | $86,350 | $30,370 | $55,980 |
| 2016 | $1,058 | $76,410 | $26,640 | $49,770 |
| 2015 | $1,066 | $76,610 | $30,580 | $46,030 |
| 2014 | -- | $73,810 | $30,580 | $43,230 |
| 2013 | -- | $78,310 | $32,280 | $46,030 |
Source: Public Records
Map
Nearby Homes
- 1818 Jackson Dr
- 4209 Kelly Rd
- 2010 Shamrock Dr NW
- 2115 Rocky Point Rd NW Unit 26
- 2115 Rocky Point Rd NW Unit 22B
- 2115 Rocky Point Rd NW Unit 6
- 2415 Rocky Point Rd NW
- 1140 Lower Marine Dr
- 1135 Morgan Rd NW Unit A & B
- 2507 Rocky Point Rd NW
- 2008 Madrona Point Dr
- 3201 17th St
- 2117 E Phinney Bay Dr
- 0 NW Shaw Island Way Unit NWM2369280
- 931 Oyster Bay Ct
- 923 Pershing Ave Unit 205
- 921 Pershing Ave Unit 203
- 1720 N Wycoff Ave
- 1340 Shorewood Dr
- 0 xxxx Vincent Way
- 1813 Rocky Point Rd NW
- 1813 Rocky Point Rd NW Unit A
- 1813 Rocky Point Rd NW Unit B
- 1729 Rocky Point Rd NW
- 1815 Rocky Point Rd NW
- 1723 Rocky Point Rd NW
- 1817 Rocky Point Rd NW
- 1821 Rocky Point Rd NW
- 1819 Jackson Dr
- 1719 Rocky Point Rd NW
- 1819 Rocky Point Rd NW
- 1751 Rocky Point Rd NW
- 1715 Rocky Point Rd NW
- 1833 Jackson Dr
- 1814 Jackson Dr
- 1902 Rocky Point Rd NW
- 4116 17th St
- 4112 17th St
- 1709 Rocky Point Rd NW