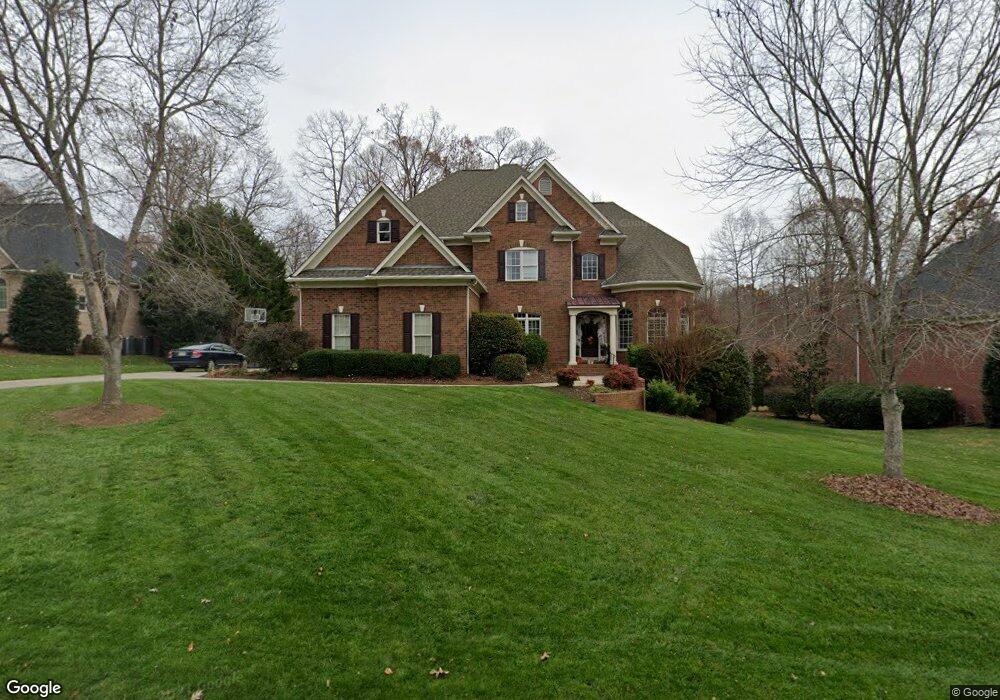
1811 Summit View Place Unit 43 Waxhaw, NC 28173
Estimated Value: $1,226,000 - $1,440,000
6
Beds
5
Baths
5,685
Sq Ft
$229/Sq Ft
Est. Value
About This Home
This home is located at 1811 Summit View Place Unit 43, Waxhaw, NC 28173 and is currently estimated at $1,301,488, approximately $228 per square foot. 1811 Summit View Place Unit 43 is a home located in Union County with nearby schools including Rea View Elementary School, Marvin Ridge Middle School, and Marvin Ridge High School.
Ownership History
Date
Name
Owned For
Owner Type
Purchase Details
Closed on
May 30, 2017
Sold by
Ronayne Christopher and Ronayne Theresa
Bought by
Boulware Michael Thorne and Boulware Andrea Renee
Current Estimated Value
Home Financials for this Owner
Home Financials are based on the most recent Mortgage that was taken out on this home.
Original Mortgage
$424,000
Outstanding Balance
$353,258
Interest Rate
4.08%
Mortgage Type
New Conventional
Estimated Equity
$948,230
Purchase Details
Closed on
Nov 22, 2002
Sold by
John Weiland Homes & Neighborhoods Of No
Bought by
Ronayne Christopher and Ronayne Theresa
Home Financials for this Owner
Home Financials are based on the most recent Mortgage that was taken out on this home.
Original Mortgage
$537,600
Interest Rate
4.87%
Mortgage Type
Adjustable Rate Mortgage/ARM
Create a Home Valuation Report for This Property
The Home Valuation Report is an in-depth analysis detailing your home's value as well as a comparison with similar homes in the area
Home Values in the Area
Average Home Value in this Area
Purchase History
| Date | Buyer | Sale Price | Title Company |
|---|---|---|---|
| Boulware Michael Thorne | $702,000 | None Available | |
| Ronayne Christopher | $685,500 | -- |
Source: Public Records
Mortgage History
| Date | Status | Borrower | Loan Amount |
|---|---|---|---|
| Open | Boulware Michael Thorne | $424,000 | |
| Previous Owner | Ronayne Christopher | $537,600 |
Source: Public Records
Tax History Compared to Growth
Tax History
| Year | Tax Paid | Tax Assessment Tax Assessment Total Assessment is a certain percentage of the fair market value that is determined by local assessors to be the total taxable value of land and additions on the property. | Land | Improvement |
|---|---|---|---|---|
| 2024 | $5,515 | $743,900 | $130,200 | $613,700 |
| 2023 | $5,349 | $743,900 | $130,200 | $613,700 |
| 2022 | $5,343 | $743,900 | $130,200 | $613,700 |
| 2021 | $5,150 | $743,900 | $130,200 | $613,700 |
| 2020 | $4,417 | $573,500 | $106,000 | $467,500 |
| 2019 | $4,681 | $573,500 | $106,000 | $467,500 |
| 2018 | $0 | $573,500 | $106,000 | $467,500 |
| 2017 | $4,934 | $573,500 | $106,000 | $467,500 |
| 2016 | $4,564 | $573,500 | $106,000 | $467,500 |
| 2015 | $4,615 | $573,500 | $106,000 | $467,500 |
| 2014 | $4,397 | $639,960 | $100,000 | $539,960 |
Source: Public Records
Map
Nearby Homes
- 8012 Avanti Dr
- 1614 Shimron Ln
- 2034 Garden Terrace Cir
- 1006 Garden Terrace Cir
- 8208 Wingard Rd
- 8219 New Town Rd
- 1814 Therrell Farms Rd
- 1619 Hawkstone Dr
- 1005 Piper Meadows Dr Unit 1
- 1301 Haywood Park Dr
- 1281 Restoration Dr
- 1288 Restoration Dr
- 8328 Victoria Lake Dr
- 8335 Victoria Lake Dr
- 804 Crooked River Dr
- 8100 Brisbin Dr
- 2413 Merryvale Way
- 2304 Coltsgate Rd
- 729 Lochaven Rd
- 2609 Twinberry Ln
- 1811 Summit View Place
- 1807 Summit View Place
- 1807 Summit View Place Unit 44
- 1815 Summit View Place
- 8037 Stonehaven Dr
- 8037 Stonehaven Dr Unit 50
- 1901 Summit View Place
- 1803 Summit View Place
- 1810 Summit View Place
- 1806 Summit View Place
- 1905 Summit View Place
- 1800 Summit View Place
- 8033 Stonehaven Dr
- 1900 Summit View Place
- 1802 Summit View Place
- 1816 Hickory Ridge Dr
- 1909 Summit View Place
- 8027 Stonehaven Dr
- 1906 Summit View Place
- 8015 Stonehaven Dr