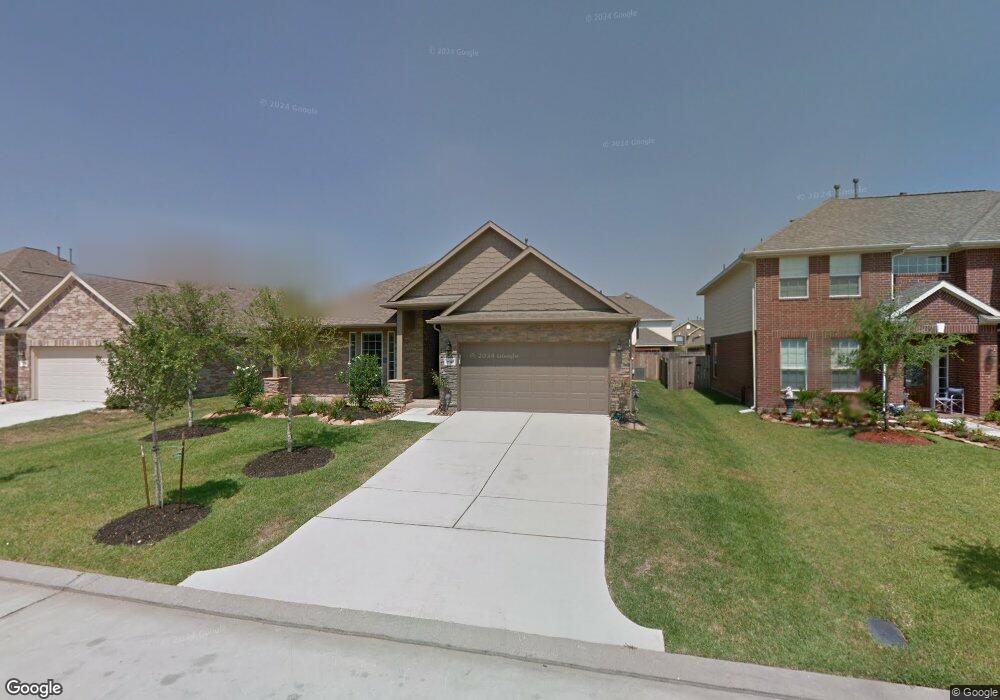
18110 Rustic Brook Ct Cypress, TX 77429
Estimated Value: $342,669 - $358,000
3
Beds
2
Baths
2,105
Sq Ft
$166/Sq Ft
Est. Value
About This Home
This home is located at 18110 Rustic Brook Ct, Cypress, TX 77429 and is currently estimated at $348,417, approximately $165 per square foot. 18110 Rustic Brook Ct is a home located in Harris County with nearby schools including Wildwood Elementary School, Oakcrest Intermediate School, and Tomball Memorial High School.
Ownership History
Date
Name
Owned For
Owner Type
Purchase Details
Closed on
Feb 24, 2014
Sold by
White Meagan L
Bought by
Warzon Kayanne E and Weikel Clayton H
Current Estimated Value
Home Financials for this Owner
Home Financials are based on the most recent Mortgage that was taken out on this home.
Original Mortgage
$183,612
Outstanding Balance
$140,273
Interest Rate
4.55%
Mortgage Type
FHA
Estimated Equity
$208,144
Purchase Details
Closed on
Sep 24, 2010
Sold by
Lennar Homes Of Texas Sales & Marketing
Bought by
White Meagan Lynn
Home Financials for this Owner
Home Financials are based on the most recent Mortgage that was taken out on this home.
Original Mortgage
$155,113
Interest Rate
4.25%
Mortgage Type
FHA
Create a Home Valuation Report for This Property
The Home Valuation Report is an in-depth analysis detailing your home's value as well as a comparison with similar homes in the area
Home Values in the Area
Average Home Value in this Area
Purchase History
| Date | Buyer | Sale Price | Title Company |
|---|---|---|---|
| Warzon Kayanne E | -- | Chicago Title Company | |
| Warzon Kayanne E | -- | Chicago Title Company | |
| White Meagan Lynn | -- | North American Title Company | |
| Lennar Homes Of Texas Sales & Marketing | -- | North American Title Company |
Source: Public Records
Mortgage History
| Date | Status | Borrower | Loan Amount |
|---|---|---|---|
| Open | Warzon Kayanne E | $183,612 | |
| Closed | Warzon Kayanne E | $183,612 | |
| Previous Owner | White Meagan Lynn | $155,113 |
Source: Public Records
Tax History Compared to Growth
Tax History
| Year | Tax Paid | Tax Assessment Tax Assessment Total Assessment is a certain percentage of the fair market value that is determined by local assessors to be the total taxable value of land and additions on the property. | Land | Improvement |
|---|---|---|---|---|
| 2025 | $7,372 | $342,536 | $61,812 | $280,724 |
| 2024 | $7,372 | $364,318 | $61,812 | $302,506 |
| 2023 | $7,372 | $370,047 | $61,812 | $308,235 |
| 2022 | $7,706 | $328,201 | $56,055 | $272,146 |
| 2021 | $7,241 | $257,021 | $40,905 | $216,116 |
| 2020 | $7,158 | $245,409 | $40,905 | $204,504 |
| 2019 | $7,160 | $238,810 | $30,300 | $208,510 |
| 2018 | $2,642 | $222,147 | $29,997 | $192,150 |
| 2017 | $6,315 | $210,142 | $29,997 | $180,145 |
| 2016 | $6,114 | $210,142 | $29,997 | $180,145 |
| 2015 | $4,746 | $205,320 | $29,997 | $175,323 |
| 2014 | $4,746 | $185,687 | $25,149 | $160,538 |
Source: Public Records
Map
Nearby Homes
- 18102 Serene Shore Dr
- 18110 Quarry Vale Dr
- 18002 Heartsong Dr
- 15206 Greenford Glen Dr
- 17923 Misty Pond Ct
- 18014 Dappled Ct
- 18510 Hayden Lakes Dr
- 17823 Dappled Walk Way
- 17818 Chelsea Dell Dr
- 17819 Chelsea Dell Dr
- 18222 Wren Song Dr
- 17811 Chelsea Dell Dr
- 17902 Banbury Green Ln
- 18614 Rimini Ridge Ct
- 15534 Cascade Mist Dr
- 15910 Grant Rd
- 18714 Stillbreeze Valley Ln
- 18630 Luma Cove Ln
- 18626 Luma Cove Ln
- 19023 Wild Thornberry Dr
- 18114 Rustic Brook Ct
- 18106 Rustic Brook Ct
- 18111 Quarry Vale Dr
- 18104 Quarry Vale Dr
- 18118 Rustic Brook Ct
- 18107 Quarry Vale Dr
- 18102 Rustic Brook Ct
- 18115 Quarry Vale Dr
- 18119 Quarry Vale Dr
- 18111 Rustic Brook Ct
- 18103 Quarry Vale Dr
- 18107 Rustic Brook Ct
- 18115 Rustic Brook Ct
- 18122 Rustic Brook Ct
- 18103 Rustic Brook Ct
- 18119 Rustic Brook Ct
- 18127 Quarry Vale Dr
- 18114 Quarry Vale Dr
- 18123 Rustic Brook Ct
- 18118 Quarry Vale Dr