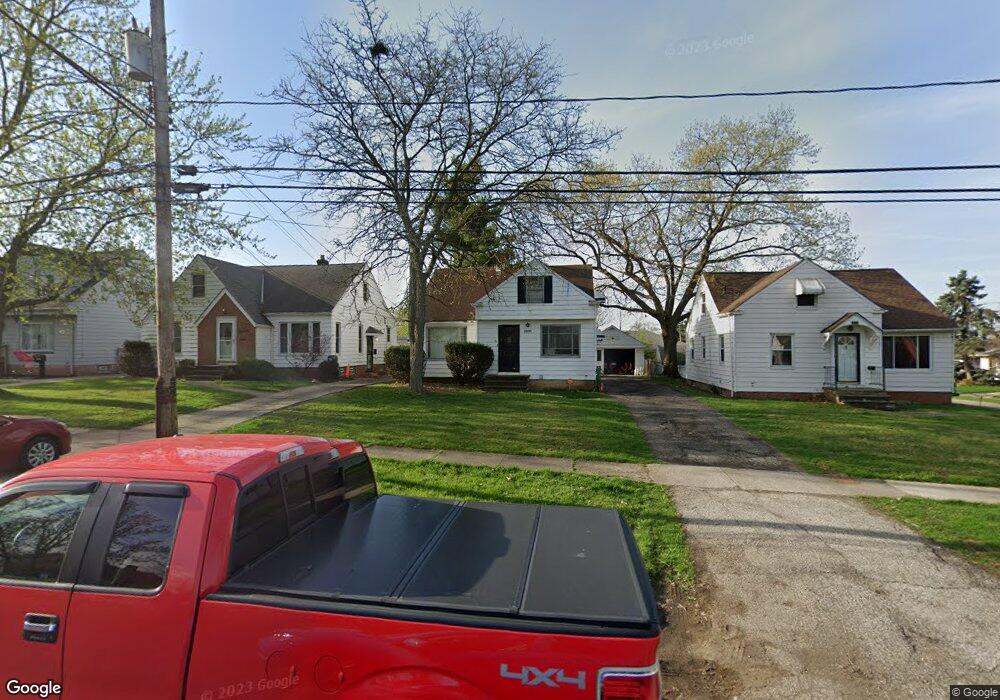
18112 Mccracken Rd Maple Heights, OH 44137
Estimated Value: $117,191 - $153,000
4
Beds
1
Bath
1,168
Sq Ft
$113/Sq Ft
Est. Value
About This Home
This home is located at 18112 Mccracken Rd, Maple Heights, OH 44137 and is currently estimated at $132,298, approximately $113 per square foot. 18112 Mccracken Rd is a home located in Cuyahoga County with nearby schools including Abraham Lincoln Elementary School, Rockside/ J.F. Kennedy School, and Barack Obama School.
Ownership History
Date
Name
Owned For
Owner Type
Purchase Details
Closed on
Nov 16, 2005
Sold by
Wells Annie M and Wells Annie
Bought by
Hudson Reginald M
Current Estimated Value
Home Financials for this Owner
Home Financials are based on the most recent Mortgage that was taken out on this home.
Original Mortgage
$108,000
Outstanding Balance
$59,175
Interest Rate
6.04%
Mortgage Type
Fannie Mae Freddie Mac
Estimated Equity
$73,123
Purchase Details
Closed on
Dec 15, 1993
Sold by
Sweeney Purnell
Bought by
Sec Of H U D
Purchase Details
Closed on
Sep 19, 1990
Sold by
Wagner Barry L and Wagner Nancy G
Bought by
Sweeney Purnell
Purchase Details
Closed on
Mar 28, 1986
Sold by
Russo Joseph C
Bought by
Wagner Barry L and Wagner Nancy G
Purchase Details
Closed on
Jun 20, 1978
Sold by
Smith Ronald Marshall
Bought by
Russo Joseph C
Purchase Details
Closed on
Aug 23, 1977
Sold by
Yokel Jos B and Yokel Marilyn
Bought by
Smith Ronald Marshall
Purchase Details
Closed on
Jan 1, 1975
Bought by
Yokel Jos B and Yokel Marilyn
Create a Home Valuation Report for This Property
The Home Valuation Report is an in-depth analysis detailing your home's value as well as a comparison with similar homes in the area
Home Values in the Area
Average Home Value in this Area
Purchase History
| Date | Buyer | Sale Price | Title Company |
|---|---|---|---|
| Hudson Reginald M | $108,000 | Mountaineer Title Agency | |
| Sec Of H U D | -- | -- | |
| Sweeney Purnell | $61,500 | -- | |
| Wagner Barry L | $49,000 | -- | |
| Russo Joseph C | $43,000 | -- | |
| Smith Ronald Marshall | $40,000 | -- | |
| Yokel Jos B | -- | -- |
Source: Public Records
Mortgage History
| Date | Status | Borrower | Loan Amount |
|---|---|---|---|
| Open | Hudson Reginald M | $108,000 |
Source: Public Records
Tax History
| Year | Tax Paid | Tax Assessment Tax Assessment Total Assessment is a certain percentage of the fair market value that is determined by local assessors to be the total taxable value of land and additions on the property. | Land | Improvement |
|---|---|---|---|---|
| 2024 | $3,974 | $35,840 | $7,315 | $28,525 |
| 2023 | $2,240 | $19,990 | $4,200 | $15,790 |
| 2022 | $2,232 | $19,990 | $4,200 | $15,790 |
| 2021 | $2,378 | $19,990 | $4,200 | $15,790 |
| 2020 | $2,040 | $15,160 | $3,190 | $11,970 |
| 2019 | $2,028 | $43,300 | $9,100 | $34,200 |
| 2018 | $2,017 | $15,160 | $3,190 | $11,970 |
| 2017 | $1,935 | $14,080 | $2,980 | $11,100 |
| 2016 | $1,870 | $14,080 | $2,980 | $11,100 |
| 2015 | $1,866 | $14,080 | $2,980 | $11,100 |
| 2014 | $1,866 | $15,480 | $3,260 | $12,220 |
Source: Public Records
Map
Nearby Homes
- 5031 Cato St
- 5100 Erwin St
- 5150 Arch St
- 5082 Philip Ave
- 18704 Longview Ave
- 17282 Mccracken Rd
- 5177 Cato St
- 18851 Raymond St
- 5219 Joseph St
- 5239 Arch St
- 18990 Raymond St
- 5231 Philip Ave
- 4821 E 173rd St
- 5246 Philip Ave
- 5194 Homewood Ave
- 17914 Libby Rd
- 5212 Catherine St
- 4744 E 176th St
- 4761 E 173rd St
- 18715 Libby Rd
- 18116 Mccracken Rd
- 18108 Mccracken Rd
- 5035 Arch St
- 18122 Mccracken Rd
- 5039 Arch St
- 5034 Joseph St
- 5030 Arch St
- 5030 Arch St Unit 2/UP
- 5030 Arch St Unit 1/DN
- 5038 Joseph St
- 5041 Arch St
- 17916 Mccracken Rd
- 5040 Joseph St
- 5034 Arch St
- 5045 Arch St
- 5038 Arch St
- 18111 Mccracken Rd
- 18200 Mccracken Rd
- 18117 Mccracken Rd
- 5050 Joseph St
Your Personal Tour Guide
Ask me questions while you tour the home.