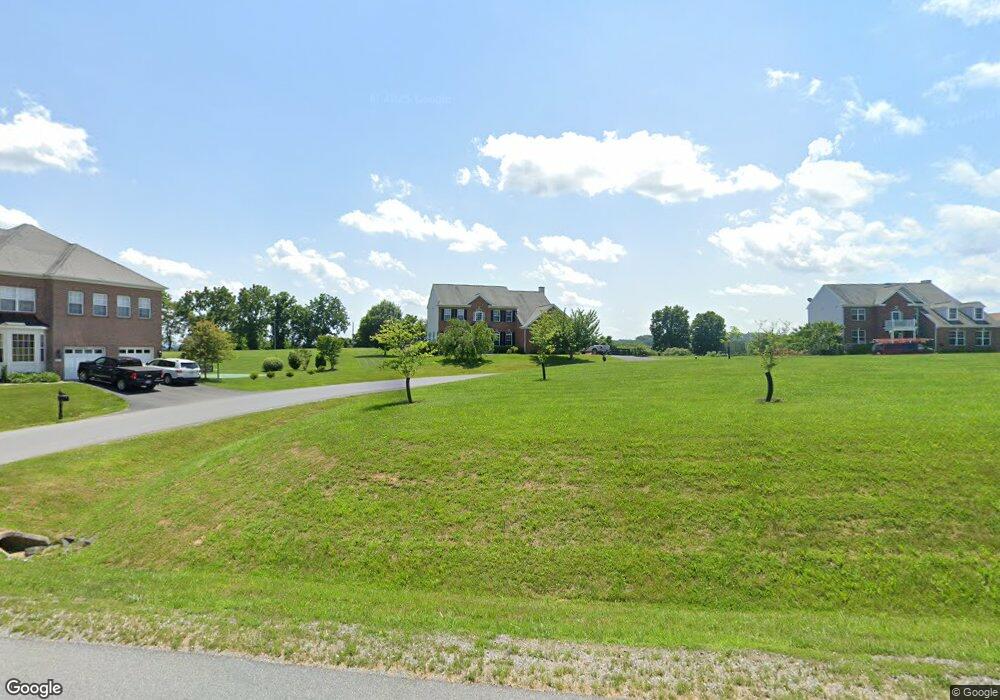
18113 South Shore Dr Purcellville, VA 20132
Estimated Value: $1,007,000 - $1,055,988
4
Beds
4
Baths
3,908
Sq Ft
$264/Sq Ft
Est. Value
About This Home
This home is located at 18113 South Shore Dr, Purcellville, VA 20132 and is currently estimated at $1,031,997, approximately $264 per square foot. 18113 South Shore Dr is a home located in Loudoun County with nearby schools including Mountain View Elementary School, Blue Ridge Middle School, and Loudoun Valley High School.
Ownership History
Date
Name
Owned For
Owner Type
Purchase Details
Closed on
Sep 5, 2012
Sold by
Perkins Eugene A
Bought by
Browning Philip R and Wood Barbara L
Current Estimated Value
Home Financials for this Owner
Home Financials are based on the most recent Mortgage that was taken out on this home.
Original Mortgage
$526,830
Outstanding Balance
$364,545
Interest Rate
3.57%
Mortgage Type
VA
Estimated Equity
$667,452
Purchase Details
Closed on
Apr 9, 2007
Sold by
Harper Lynn E
Bought by
Perkins Eugene A
Home Financials for this Owner
Home Financials are based on the most recent Mortgage that was taken out on this home.
Original Mortgage
$493,050
Interest Rate
6.25%
Mortgage Type
New Conventional
Purchase Details
Closed on
Jan 12, 2007
Sold by
Arcadia Woodmar Llc
Bought by
Harper Lynn E
Create a Home Valuation Report for This Property
The Home Valuation Report is an in-depth analysis detailing your home's value as well as a comparison with similar homes in the area
Home Values in the Area
Average Home Value in this Area
Purchase History
| Date | Buyer | Sale Price | Title Company |
|---|---|---|---|
| Browning Philip R | $510,000 | -- | |
| Perkins Eugene A | $519,000 | -- | |
| Harper Lynn E | $556,753 | -- |
Source: Public Records
Mortgage History
| Date | Status | Borrower | Loan Amount |
|---|---|---|---|
| Open | Browning Philip R | $526,830 | |
| Previous Owner | Perkins Eugene A | $493,050 |
Source: Public Records
Tax History Compared to Growth
Tax History
| Year | Tax Paid | Tax Assessment Tax Assessment Total Assessment is a certain percentage of the fair market value that is determined by local assessors to be the total taxable value of land and additions on the property. | Land | Improvement |
|---|---|---|---|---|
| 2025 | $8,311 | $1,032,360 | $240,500 | $791,860 |
| 2024 | $8,351 | $965,390 | $260,500 | $704,890 |
| 2023 | $8,497 | $971,120 | $190,500 | $780,620 |
| 2022 | $7,516 | $844,510 | $175,500 | $669,010 |
| 2021 | $6,558 | $669,150 | $145,500 | $523,650 |
| 2020 | $6,461 | $624,280 | $125,500 | $498,780 |
| 2019 | $6,338 | $606,460 | $125,500 | $480,960 |
| 2018 | $6,434 | $593,020 | $125,500 | $467,520 |
| 2017 | $6,513 | $578,950 | $125,500 | $453,450 |
| 2016 | $6,537 | $570,960 | $0 | $0 |
| 2015 | $6,185 | $419,440 | $0 | $419,440 |
| 2014 | $6,248 | $424,570 | $0 | $424,570 |
Source: Public Records
Map
Nearby Homes
- 36514 Winding Oak Place
- 36483 Winding Oak Place
- 36824 Paxson Rd
- 18302 Poplar Stand Place
- 309 Bill Brower Ct
- 221 S 32nd St
- 18140 Ridgewood Place
- 420 S 20th St
- 17571 Lethridge Cir
- 36169 E Loudoun St
- 250 W Main St
- 3 Springbury Dr
- The Ashton I Plan at Valley Springs Estates
- The Ashton II Plan at Valley Springs Estates
- The Oakhall Plan at Valley Springs Estates
- The Elmsgate Plan at Valley Springs Estates
- 141 S Nursery Ave
- 37517 Bernardini Ct
- 109 Amalfi Ct
- 19116 Nicholson Farm Ln
- 18113 South Shore Dr
- 18117 South Shore Dr Unit 31
- 18117 South Shore Dr
- 18117 South Shore Dr
- 18109 South Shore Dr
- 18109 S Shore Dr
- 18105 South Shore Dr
- 36637 Woodmar Farm Dr Unit 32
- 36637 Woodmar Farm Dr
- 18105 S Shore Dr
- 36632 Woodmar Farm Dr
- 36624 Woodmar Farm Dr
- 36628 Woodmar Farm Dr
- 36616 Woodmar Farm Dr
- 36620 Woodmar Farm Dr
- 36641 Woodmar Farm Dr Unit 33
- 36641 Woodmar Farm Dr
- 18101 South Shore Dr
- 18101 S Shore Dr
- 36645 Woodmar Farm Dr Unit 34