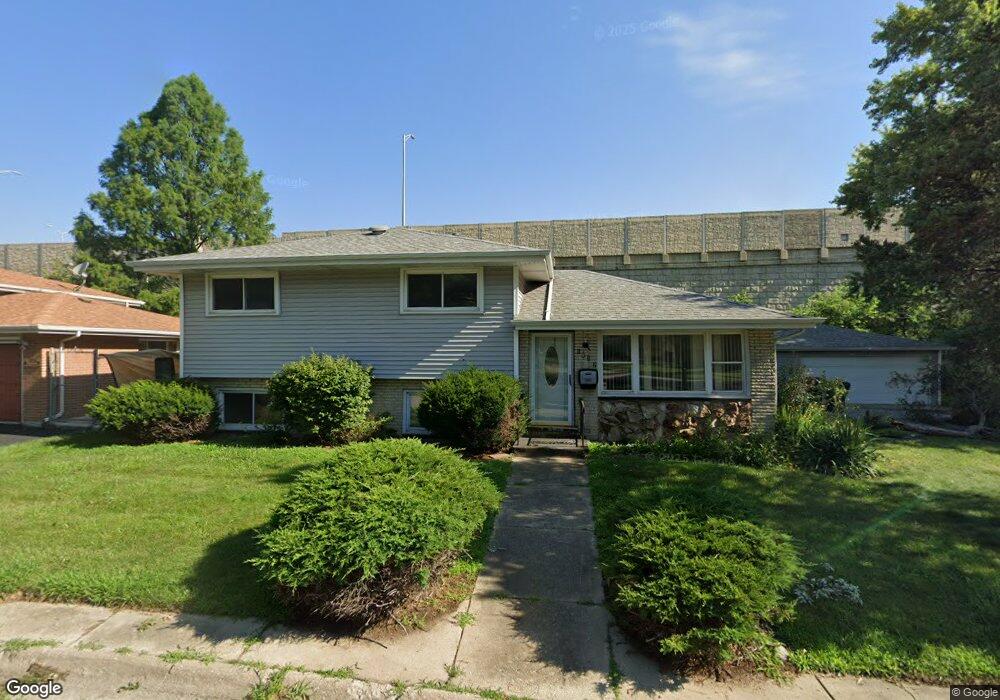
1812 172nd St Hazel Crest, IL 60429
Estimated Value: $131,000 - $166,120
3
Beds
1
Bath
1,136
Sq Ft
$129/Sq Ft
Est. Value
About This Home
This home is located at 1812 172nd St, Hazel Crest, IL 60429 and is currently estimated at $146,280, approximately $128 per square foot. 1812 172nd St is a home located in Cook County with nearby schools including Thornwood High School.
Ownership History
Date
Name
Owned For
Owner Type
Purchase Details
Closed on
Jun 12, 2023
Sold by
Cash Value Offer Llc
Bought by
1212 Incorporated
Current Estimated Value
Purchase Details
Closed on
Nov 16, 2022
Sold by
Haddon Marilyn
Bought by
Cash Value Offer Llc
Home Financials for this Owner
Home Financials are based on the most recent Mortgage that was taken out on this home.
Original Mortgage
$129,590
Interest Rate
1.23%
Mortgage Type
Construction
Purchase Details
Closed on
Dec 27, 2005
Sold by
Elshafei Alan and Elshafi Alan
Bought by
Dixie Highway Development Llc
Purchase Details
Closed on
Apr 8, 2004
Sold by
Family Bank & Trust Co
Bought by
Elshafi Alan
Create a Home Valuation Report for This Property
The Home Valuation Report is an in-depth analysis detailing your home's value as well as a comparison with similar homes in the area
Home Values in the Area
Average Home Value in this Area
Purchase History
| Date | Buyer | Sale Price | Title Company |
|---|---|---|---|
| 1212 Incorporated | $118,000 | Fidelity National Title | |
| Cash Value Offer Llc | $83,000 | Chicago Title | |
| Dixie Highway Development Llc | $242,000 | -- | |
| Elshafi Alan | $150,000 | Git |
Source: Public Records
Mortgage History
| Date | Status | Borrower | Loan Amount |
|---|---|---|---|
| Previous Owner | Cash Value Offer Llc | $129,590 |
Source: Public Records
Tax History Compared to Growth
Tax History
| Year | Tax Paid | Tax Assessment Tax Assessment Total Assessment is a certain percentage of the fair market value that is determined by local assessors to be the total taxable value of land and additions on the property. | Land | Improvement |
|---|---|---|---|---|
| 2024 | $6,236 | $12,000 | $2,905 | $9,095 |
| 2023 | $303 | $12,000 | $2,905 | $9,095 |
| 2022 | $303 | $7,307 | $2,542 | $4,765 |
| 2021 | $295 | $7,306 | $2,542 | $4,764 |
| 2020 | $295 | $7,306 | $2,542 | $4,764 |
| 2019 | $1,642 | $10,648 | $2,360 | $8,288 |
| 2018 | $1,627 | $10,648 | $2,360 | $8,288 |
| 2017 | $1,606 | $10,648 | $2,360 | $8,288 |
| 2016 | $3,086 | $10,495 | $2,178 | $8,317 |
| 2015 | $2,848 | $10,495 | $2,178 | $8,317 |
| 2014 | $2,852 | $10,495 | $2,178 | $8,317 |
| 2013 | $3,100 | $11,570 | $2,178 | $9,392 |
Source: Public Records
Map
Nearby Homes
- 17212 Hawthorne Dr
- 1903 171st St
- 1848 172nd St
- 17222 Country Ln
- 1921 171st St
- 17046 Winchester Ave
- 17308 Forestway Dr
- 1913 170th St
- 17064 Shea Ave
- 16929 Wood St
- 16919 Wood St
- 16910 Lincoln St
- 16930 Winchester Ave
- 2030 170th St
- 17026 Bulger Ave
- 1514 173rd St
- 1710 169th St
- 16918 Shea Ave
- 2131 170th St
- 17231 Laflin Ave
- 1816 172nd St
- 17202 Hawthorne Dr
- 1820 172nd St
- 17123 Hawthorne Dr
- 17201 Hawthorne Dr
- 17204 Hawthorne Dr
- 17203 Hawthorne Dr
- 1824 172nd St
- 17205 Hawthorne Dr
- 17206 Hawthorne Dr
- 1823 172nd St
- 17208 Hawthorne Dr
- 1828 172nd St
- 17209 Hawthorne Dr
- 1827 172nd St
- 1825 172nd St
- 17210 Hawthorne Dr
- 17211 Hawthorne Dr
- 17201 Country Ln
- 1832 172nd St