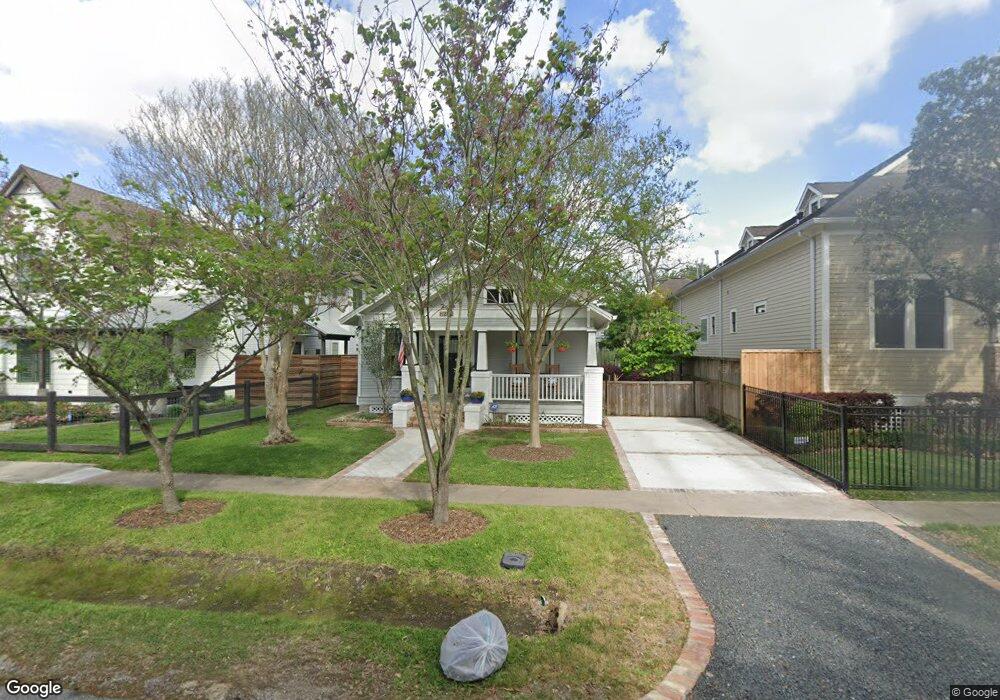
1812 Arlington St Houston, TX 77008
Greater Heights NeighborhoodEstimated Value: $699,000 - $733,000
2
Beds
1
Bath
1,476
Sq Ft
$485/Sq Ft
Est. Value
About This Home
This home is located at 1812 Arlington St, Houston, TX 77008 and is currently estimated at $716,470, approximately $485 per square foot. 1812 Arlington St is a home located in Harris County with nearby schools including Field Elementary School, Hamilton Middle, and Heights High School.
Ownership History
Date
Name
Owned For
Owner Type
Purchase Details
Closed on
Jul 14, 2010
Sold by
Young Scott S and Young Christine L
Bought by
Calabrese Ruth Katz and Calabrese Scott J
Current Estimated Value
Home Financials for this Owner
Home Financials are based on the most recent Mortgage that was taken out on this home.
Original Mortgage
$325,600
Outstanding Balance
$217,013
Interest Rate
4.78%
Mortgage Type
New Conventional
Estimated Equity
$499,457
Purchase Details
Closed on
Aug 16, 2002
Sold by
Quinn Mary Frances
Bought by
Young Scott S
Home Financials for this Owner
Home Financials are based on the most recent Mortgage that was taken out on this home.
Original Mortgage
$122,888
Interest Rate
6.6%
Purchase Details
Closed on
Aug 16, 1994
Sold by
Kelly Jane Quinn
Bought by
Kelly Jane Quinn and The Horace E & Jane R Kelly Irrevocable
Purchase Details
Closed on
Jul 27, 1993
Sold by
Kelly Jane Quinn
Bought by
Kelly Horace E and Kelly Jane R
Create a Home Valuation Report for This Property
The Home Valuation Report is an in-depth analysis detailing your home's value as well as a comparison with similar homes in the area
Home Values in the Area
Average Home Value in this Area
Purchase History
| Date | Buyer | Sale Price | Title Company |
|---|---|---|---|
| Calabrese Ruth Katz | -- | Old Republic Title Company O | |
| Young Scott S | -- | North American Title Co | |
| Kelly Jane Quinn | -- | -- | |
| Kelly Horace E | -- | -- | |
| Quinn Mary Frances | -- | -- |
Source: Public Records
Mortgage History
| Date | Status | Borrower | Loan Amount |
|---|---|---|---|
| Open | Calabrese Ruth Katz | $325,600 | |
| Previous Owner | Young Scott S | $122,888 | |
| Closed | Young Scott S | $23,040 |
Source: Public Records
Tax History Compared to Growth
Tax History
| Year | Tax Paid | Tax Assessment Tax Assessment Total Assessment is a certain percentage of the fair market value that is determined by local assessors to be the total taxable value of land and additions on the property. | Land | Improvement |
|---|---|---|---|---|
| 2025 | $10,291 | $675,808 | $594,000 | $81,808 |
| 2024 | $10,291 | $665,523 | $594,000 | $71,523 |
| 2023 | $10,291 | $768,179 | $594,000 | $174,179 |
| 2022 | $9,883 | $583,000 | $462,000 | $121,000 |
| 2021 | $13,869 | $578,000 | $462,000 | $116,000 |
| 2020 | $13,644 | $563,444 | $462,000 | $101,444 |
| 2019 | $13,331 | $526,832 | $429,000 | $97,832 |
| 2018 | $10,710 | $541,285 | $396,000 | $145,285 |
| 2017 | $12,718 | $541,285 | $396,000 | $145,285 |
| 2016 | $11,562 | $541,285 | $396,000 | $145,285 |
| 2015 | $7,633 | $477,976 | $330,000 | $147,976 |
| 2014 | $7,633 | $417,873 | $277,200 | $140,673 |
Source: Public Records
Map
Nearby Homes
- 1823 Arlington St
- 1846 Arlington St
- 1819 Oxford St
- 1819 Cortlandt St
- 1611 Columbia St
- 1847 Cortlandt St
- 121 E 18th St
- 1811 Harvard St
- 2017 Cortlandt St
- 1847 Harvard St
- 710 E 18th St
- 2117 Gostick St
- 2219 Arlington St
- 607 E 15th St
- 2124 Gostick St
- 714 E 21st St
- 2222 Oxford St
- 2206 Singleton St
- 1819 Studewood St
- 2214 Singleton St
- 1816 Arlington St
- 1808 Arlington St
- 1820 Arlington St
- 401 E 18th St
- 1809 Columbia St
- 1803 Columbia St
- 1822 Arlington St
- 1815 Columbia St
- 1811 Arlington St
- 1801 Columbia St
- 1817 Columbia St
- 1801 Arlington St
- 1828 Arlington St
- 1819 Columbia St
- 1815 Arlington St
- 412 E 18th St
- 414 E 18th St
- 1821 Columbia St
- 1830 Arlington St
- 319 E 18th St