Estimated Value: $74,121 - $104,000
2
Beds
1
Bath
720
Sq Ft
$120/Sq Ft
Est. Value
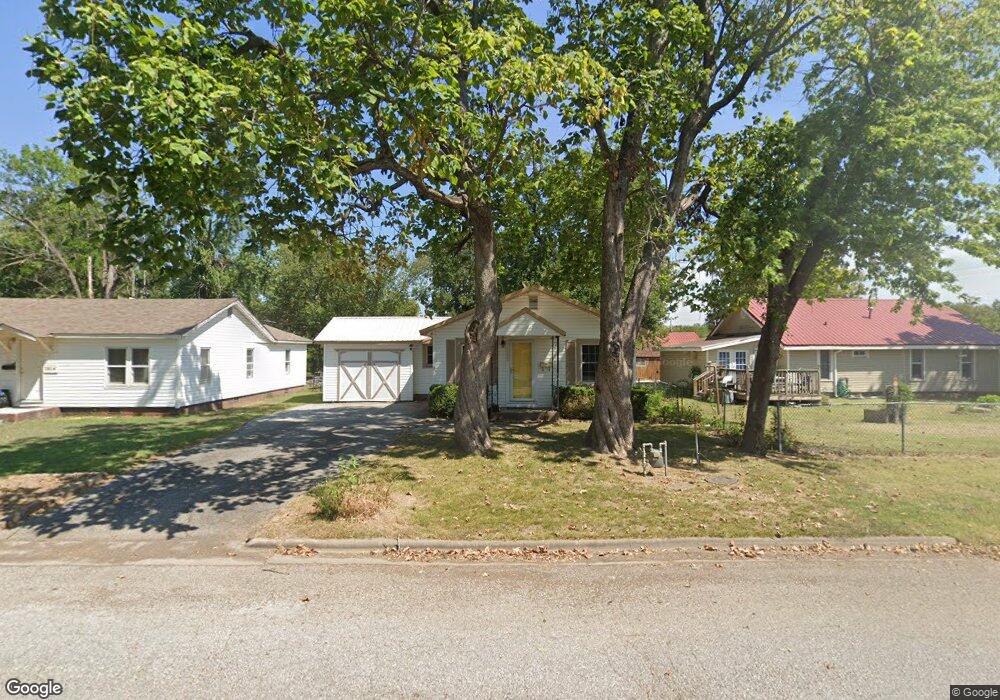
About This Home
This home is located at 1812 B St NE, Miami, OK 74354 and is currently estimated at $86,530, approximately $120 per square foot. 1812 B St NE is a home located in Ottawa County with nearby schools including Miami High School and Mt. Olive Lutheran School.
Ownership History
Date
Name
Owned For
Owner Type
Purchase Details
Closed on
Dec 27, 2007
Sold by
Pritchard Daniel L and Pritchard Holly C
Bought by
Gotchal Gwendolyn
Current Estimated Value
Home Financials for this Owner
Home Financials are based on the most recent Mortgage that was taken out on this home.
Original Mortgage
$11,978
Interest Rate
6.07%
Mortgage Type
New Conventional
Purchase Details
Closed on
Mar 31, 2003
Bought by
Pritchard Matt and Pritchard Amber
Purchase Details
Closed on
Sep 23, 1994
Bought by
Davidson Garry and Davidson Barbara
Create a Home Valuation Report for This Property
The Home Valuation Report is an in-depth analysis detailing your home's value as well as a comparison with similar homes in the area
Home Values in the Area
Average Home Value in this Area
Purchase History
| Date | Buyer | Sale Price | Title Company |
|---|---|---|---|
| Gotchal Gwendolyn | $56,500 | None Available | |
| Pritchard Matt | $420,000 | -- | |
| Davidson Garry | $7,000 | -- |
Source: Public Records
Mortgage History
| Date | Status | Borrower | Loan Amount |
|---|---|---|---|
| Closed | Gotchal Gwendolyn | $11,978 | |
| Open | Gotchal Gwendolyn | $47,912 |
Source: Public Records
Tax History Compared to Growth
Tax History
| Year | Tax Paid | Tax Assessment Tax Assessment Total Assessment is a certain percentage of the fair market value that is determined by local assessors to be the total taxable value of land and additions on the property. | Land | Improvement |
|---|---|---|---|---|
| 2025 | $514 | $6,523 | $570 | $5,953 |
| 2024 | $514 | $6,333 | $570 | $5,763 |
| 2023 | $514 | $6,148 | $570 | $5,578 |
| 2022 | $459 | $5,969 | $570 | $5,399 |
| 2021 | $453 | $5,795 | $570 | $5,225 |
| 2020 | $441 | $5,627 | $570 | $5,057 |
| 2019 | $371 | $5,517 | $536 | $4,981 |
| 2018 | $373 | $5,517 | $536 | $4,981 |
| 2017 | $380 | $5,517 | $536 | $4,981 |
| 2016 | $456 | $5,677 | $536 | $5,141 |
| 2015 | $163 | $1,840 | $398 | $1,442 |
| 2014 | $528 | $6,441 | $342 | $6,099 |
Source: Public Records
Map
Nearby Homes