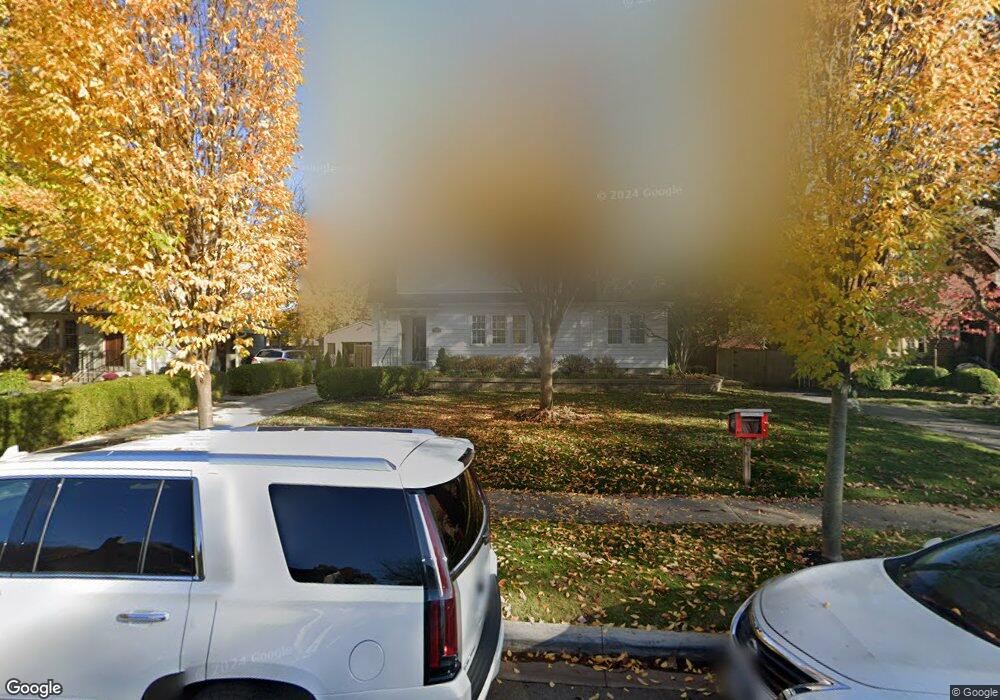
1812 Bedford Rd Columbus, OH 43212
Estimated Value: $700,000 - $757,416
4
Beds
2
Baths
2,108
Sq Ft
$345/Sq Ft
Est. Value
About This Home
This home is located at 1812 Bedford Rd, Columbus, OH 43212 and is currently estimated at $728,104, approximately $345 per square foot. 1812 Bedford Rd is a home located in Franklin County with nearby schools including Barrington Road Elementary School, Jones Middle School, and Upper Arlington High School.
Ownership History
Date
Name
Owned For
Owner Type
Purchase Details
Closed on
Feb 28, 2006
Sold by
Cendant Mobility Financial Corp
Bought by
Clevenger Scott and Clevenger Nicole
Current Estimated Value
Home Financials for this Owner
Home Financials are based on the most recent Mortgage that was taken out on this home.
Original Mortgage
$236,000
Outstanding Balance
$133,614
Interest Rate
6.2%
Mortgage Type
Fannie Mae Freddie Mac
Estimated Equity
$594,490
Purchase Details
Closed on
Aug 31, 2005
Sold by
Hall Peter C and Hall Gwendolyn K
Bought by
Cendant Mobility Financial Corp
Purchase Details
Closed on
Sep 6, 2000
Sold by
Disalvo Darla M
Bought by
Hall Peter C and Hall Gwendolyn K
Home Financials for this Owner
Home Financials are based on the most recent Mortgage that was taken out on this home.
Original Mortgage
$184,900
Interest Rate
8.14%
Purchase Details
Closed on
Mar 31, 1989
Bought by
Disalvo Darla M
Create a Home Valuation Report for This Property
The Home Valuation Report is an in-depth analysis detailing your home's value as well as a comparison with similar homes in the area
Home Values in the Area
Average Home Value in this Area
Purchase History
| Date | Buyer | Sale Price | Title Company |
|---|---|---|---|
| Clevenger Scott | $295,000 | Talon Group | |
| Cendant Mobility Financial Corp | $295,000 | Talon Group | |
| Hall Peter C | $234,900 | Chicago Title | |
| Disalvo Darla M | -- | -- |
Source: Public Records
Mortgage History
| Date | Status | Borrower | Loan Amount |
|---|---|---|---|
| Open | Clevenger Scott | $236,000 | |
| Previous Owner | Hall Peter C | $184,900 |
Source: Public Records
Tax History Compared to Growth
Tax History
| Year | Tax Paid | Tax Assessment Tax Assessment Total Assessment is a certain percentage of the fair market value that is determined by local assessors to be the total taxable value of land and additions on the property. | Land | Improvement |
|---|---|---|---|---|
| 2024 | $13,572 | $234,430 | $118,300 | $116,130 |
| 2023 | $13,425 | $234,430 | $118,300 | $116,130 |
| 2022 | $11,982 | $171,470 | $65,350 | $106,120 |
| 2021 | $10,607 | $171,470 | $65,350 | $106,120 |
| 2020 | $10,530 | $171,470 | $65,350 | $106,120 |
| 2019 | $10,631 | $153,310 | $65,350 | $87,960 |
| 2018 | $9,297 | $153,310 | $65,350 | $87,960 |
| 2017 | $9,290 | $153,310 | $65,350 | $87,960 |
| 2016 | $8,031 | $121,460 | $50,720 | $70,740 |
| 2015 | $8,024 | $121,460 | $50,720 | $70,740 |
| 2014 | $8,033 | $121,460 | $50,720 | $70,740 |
| 2013 | $3,835 | $110,390 | $46,095 | $64,295 |
Source: Public Records
Map
Nearby Homes
- 1782 Wyandotte Rd
- 1733 Elmwood Ave
- 1661 Ashland Ave Unit 663
- 1655-1657 Ashland Ave
- 2015 W 5th Ave Unit 211
- 2015 W 5th Ave Unit 102
- 2015 W 5th Ave Unit 108
- 1561 Glenn Ave
- 2110 Northwest Blvd
- 1631 Roxbury Rd Unit F3
- 1631 Roxbury Rd Unit B6
- 1459 Elmwood Ave Unit 1459
- 1398 Lower Green Cir Unit 1398
- 1869 Tewksbury Rd
- 1535 Doone Rd
- 2063 Westover Rd
- 1364 W 7th Ave
- 1313 Lincoln Rd
- 1565 Berkshire Rd
- 00 W 7th Ave
- 1800 Bedford Rd
- 1818 Bedford Rd
- 1796 Bedford Rd
- 1803 Andover Rd
- 1793 Andover Rd
- 1785 Andover Rd
- 1811 Tremont Rd
- 1790 Bedford Rd
- 1811 Bedford Rd
- 1845 Tremont Rd
- 1781 Andover Rd
- 1795 Bedford Rd
- 1784 Bedford Rd
- 1773 Andover Rd
- 1824 Tremont Rd
- 1789 Bedford Rd
- 1765 Andover Rd
- 1798 Andover Rd
- 1792 Andover Rd
- 1776 Bedford Rd