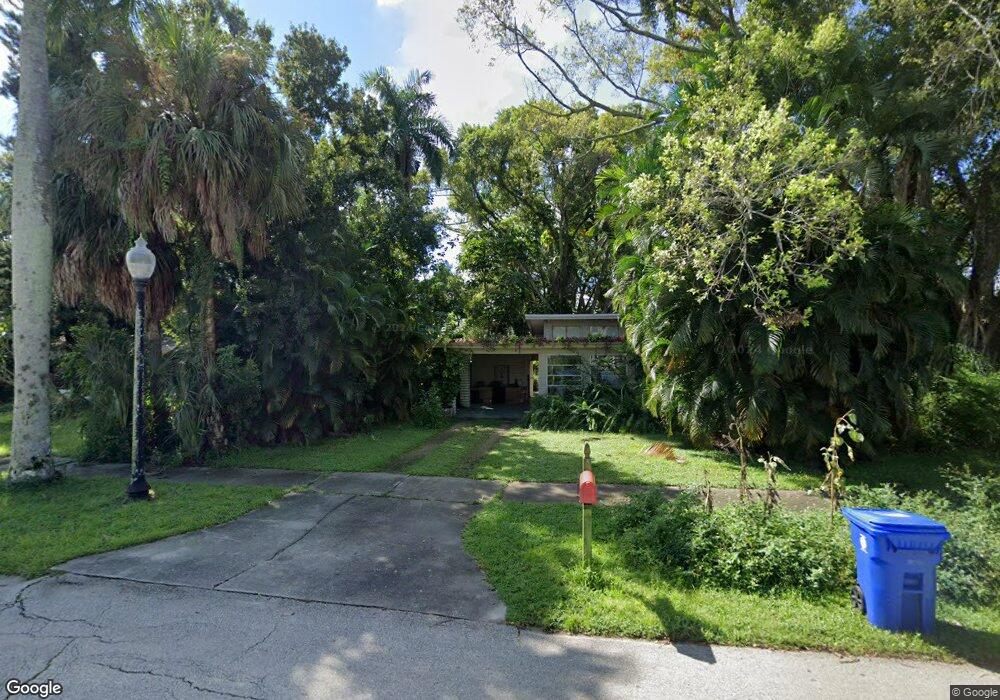
1812 Braman Ave Fort Myers, FL 33901
Sunset Park NeighborhoodEstimated Value: $198,414 - $222,000
2
Beds
1
Bath
1,012
Sq Ft
$208/Sq Ft
Est. Value
About This Home
This home is located at 1812 Braman Ave, Fort Myers, FL 33901 and is currently estimated at $210,604, approximately $208 per square foot. 1812 Braman Ave is a home located in Lee County with nearby schools including Allen Park Elementary School, Edison Park Creative & Expressive Arts School, and Orangewood Elementary School.
Ownership History
Date
Name
Owned For
Owner Type
Purchase Details
Closed on
Apr 7, 2014
Sold by
Sevilla Jose
Bought by
Sevilla Daniel
Current Estimated Value
Purchase Details
Closed on
Mar 23, 2010
Sold by
Sevilla Maria Del Carmen
Bought by
Sevilla Jose Luis
Purchase Details
Closed on
Jun 15, 2009
Sold by
Sevilla Jose Luis
Bought by
Sevilla Maria Del Carmen
Purchase Details
Closed on
Apr 22, 2009
Sold by
Hsbc Bank Usa National Association
Bought by
Sevilla Jose
Purchase Details
Closed on
Feb 24, 2009
Sold by
Coyne Gary Charles
Bought by
Homesales Inc
Purchase Details
Closed on
Nov 25, 1996
Sold by
Shadoin Mary Lou
Bought by
Coyne Gary Charles
Home Financials for this Owner
Home Financials are based on the most recent Mortgage that was taken out on this home.
Original Mortgage
$47,500
Interest Rate
7.83%
Create a Home Valuation Report for This Property
The Home Valuation Report is an in-depth analysis detailing your home's value as well as a comparison with similar homes in the area
Home Values in the Area
Average Home Value in this Area
Purchase History
| Date | Buyer | Sale Price | Title Company |
|---|---|---|---|
| Sevilla Daniel | -- | None Available | |
| Sevilla Jose Luis | -- | None Available | |
| Sevilla Maria Del Carmen | -- | None Available | |
| Sevilla Jose | $26,000 | Attorney | |
| Hsbc Bank Usa National Association | -- | Attorney | |
| Homesales Inc | -- | Attorney | |
| Coyne Gary Charles | $50,500 | -- |
Source: Public Records
Mortgage History
| Date | Status | Borrower | Loan Amount |
|---|---|---|---|
| Previous Owner | Coyne Gary Charles | $47,500 |
Source: Public Records
Tax History Compared to Growth
Tax History
| Year | Tax Paid | Tax Assessment Tax Assessment Total Assessment is a certain percentage of the fair market value that is determined by local assessors to be the total taxable value of land and additions on the property. | Land | Improvement |
|---|---|---|---|---|
| 2025 | $879 | $40,014 | -- | -- |
| 2024 | $833 | $38,886 | -- | -- |
| 2023 | $833 | $37,753 | $0 | $0 |
| 2022 | $826 | $36,653 | $0 | $0 |
| 2021 | $792 | $104,186 | $41,611 | $62,575 |
| 2020 | $675 | $35,094 | $0 | $0 |
| 2019 | $653 | $34,305 | $0 | $0 |
| 2018 | $644 | $33,665 | $0 | $0 |
| 2017 | $606 | $32,973 | $0 | $0 |
| 2016 | $570 | $55,718 | $38,347 | $17,371 |
| 2015 | $515 | $46,997 | $24,253 | $22,744 |
| 2014 | $459 | $51,002 | $24,532 | $26,470 |
| 2013 | -- | $49,105 | $14,438 | $34,667 |
Source: Public Records
Map
Nearby Homes
- 1749 Braman Ave
- 1830 Grace Ave
- 1862 Moreno Ave
- 1758 Coronado Rd
- 1918 Grace Ave
- 1615 Grace Ave
- 1849 Maravilla Ave Unit C6
- 1849 Maravilla Ave Unit C9
- 1849 Maravilla Ave Unit A10
- 1849 Maravilla Ave Unit B3
- 2968 Sunset Rd
- 1830 Maravilla Ave Unit 317
- 1830 Maravilla Ave Unit 416
- 1830 Maravilla Ave Unit 413
- 1830 Maravilla Ave Unit 516
- 1830 Maravilla Ave Unit 612
- 1830 Maravilla Ave Unit 314
- 2252 / 2254 Maple Ave
- 1551 Passaic Ave
- 2963 Holly Rd
- 1804 Braman Ave
- 1822 Braman Ave
- 1830 Braman Ave Unit AE
- 1817 Moreno Ave
- 3129 Sunset Rd
- 1764 Braman Ave
- 1827 Moreno Ave
- 1809 Braman Ave
- 1821 Braman Ave Unit 4
- 3124 Sunset Rd
- 1846 Braman Ave
- 1829 Braman Ave
- 1769 Braman Ave
- 3138 Sunset Rd
- 1750 Braman Ave
- 1843 Braman Ave
- 1759 Braman Ave
- 1816 Moreno Ave
- 1822 Moreno Ave