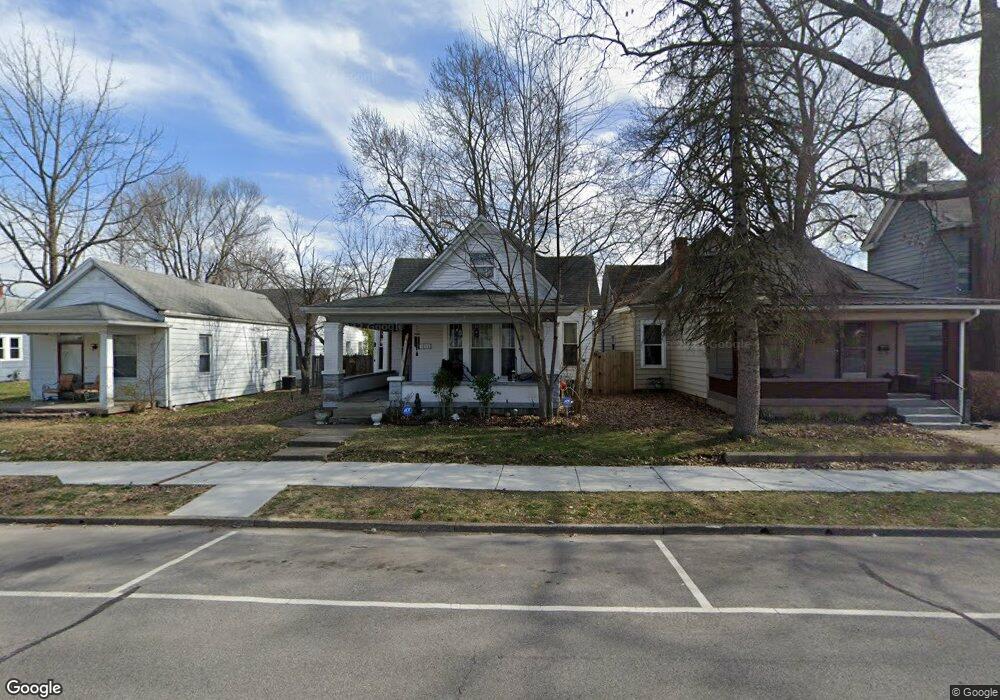
1812 E Elm St New Albany, IN 47150
Estimated Value: $109,000 - $250,000
3
Beds
2
Baths
2,112
Sq Ft
$96/Sq Ft
Est. Value
About This Home
This home is located at 1812 E Elm St, New Albany, IN 47150 and is currently estimated at $203,490, approximately $96 per square foot. 1812 E Elm St is a home located in Floyd County with nearby schools including Slate Run Elementary School, Hazelwood Middle School, and New Albany Senior High School.
Ownership History
Date
Name
Owned For
Owner Type
Purchase Details
Closed on
Jul 31, 2009
Sold by
Fender Christopher A
Bought by
Neafus Michael B
Current Estimated Value
Purchase Details
Closed on
Dec 12, 2007
Sold by
Cornett Jim
Bought by
Fender Christopher A
Home Financials for this Owner
Home Financials are based on the most recent Mortgage that was taken out on this home.
Original Mortgage
$86,000
Interest Rate
6.27%
Mortgage Type
New Conventional
Purchase Details
Closed on
Jul 29, 2005
Sold by
Fannie Mae
Bought by
Cornett Jlm and Jtc Llc
Home Financials for this Owner
Home Financials are based on the most recent Mortgage that was taken out on this home.
Original Mortgage
$76,000
Interest Rate
5.66%
Mortgage Type
Future Advance Clause Open End Mortgage
Purchase Details
Closed on
Jan 11, 2005
Sold by
Snawder Joseph
Bought by
Countrywide Home Loans Inc
Purchase Details
Closed on
Dec 6, 2004
Sold by
Countrywide Home Loans Inc
Bought by
Federal National Mortgage Association
Create a Home Valuation Report for This Property
The Home Valuation Report is an in-depth analysis detailing your home's value as well as a comparison with similar homes in the area
Home Values in the Area
Average Home Value in this Area
Purchase History
| Date | Buyer | Sale Price | Title Company |
|---|---|---|---|
| Neafus Michael B | -- | None Available | |
| Fender Christopher A | -- | None Available | |
| Cornett Jlm | -- | None Available | |
| Countrywide Home Loans Inc | $99,485 | None Available | |
| Federal National Mortgage Association | -- | None Available |
Source: Public Records
Mortgage History
| Date | Status | Borrower | Loan Amount |
|---|---|---|---|
| Previous Owner | Fender Christopher A | $86,000 | |
| Previous Owner | Cornett Jlm | $76,000 |
Source: Public Records
Tax History Compared to Growth
Tax History
| Year | Tax Paid | Tax Assessment Tax Assessment Total Assessment is a certain percentage of the fair market value that is determined by local assessors to be the total taxable value of land and additions on the property. | Land | Improvement |
|---|---|---|---|---|
| 2024 | $1,964 | $92,500 | $17,800 | $74,700 |
| 2023 | $1,831 | $85,800 | $17,800 | $68,000 |
| 2022 | $1,634 | $76,500 | $17,800 | $58,700 |
| 2021 | $1,474 | $68,500 | $17,800 | $50,700 |
| 2020 | $1,414 | $65,600 | $17,800 | $47,800 |
| 2019 | $1,454 | $67,400 | $17,800 | $49,600 |
| 2018 | $1,413 | $65,100 | $17,800 | $47,300 |
| 2017 | $1,376 | $62,300 | $17,800 | $44,500 |
| 2016 | $1,240 | $62,000 | $17,800 | $44,200 |
| 2014 | $1,086 | $54,300 | $17,800 | $36,500 |
| 2013 | -- | $54,600 | $19,400 | $35,200 |
Source: Public Records
Map
Nearby Homes
- 1814 E Elm St
- 1810 E Elm St
- 1816 E Elm St
- 1808 E Elm St
- 1818 E Elm St
- 1804 E Elm St
- 1820 E Elm St
- 416 E 18th St
- 1802 E Elm St
- 1822 E Elm St
- 1813 E Spring St
- 1815 E Spring St
- 1811 E Spring St
- 1809 E Spring St
- 1824 E Elm St
- 1819 E Spring St
- 1807 E Spring St
- 1821 E Spring St
- 1811 E Elm St
- 1813 E Elm St