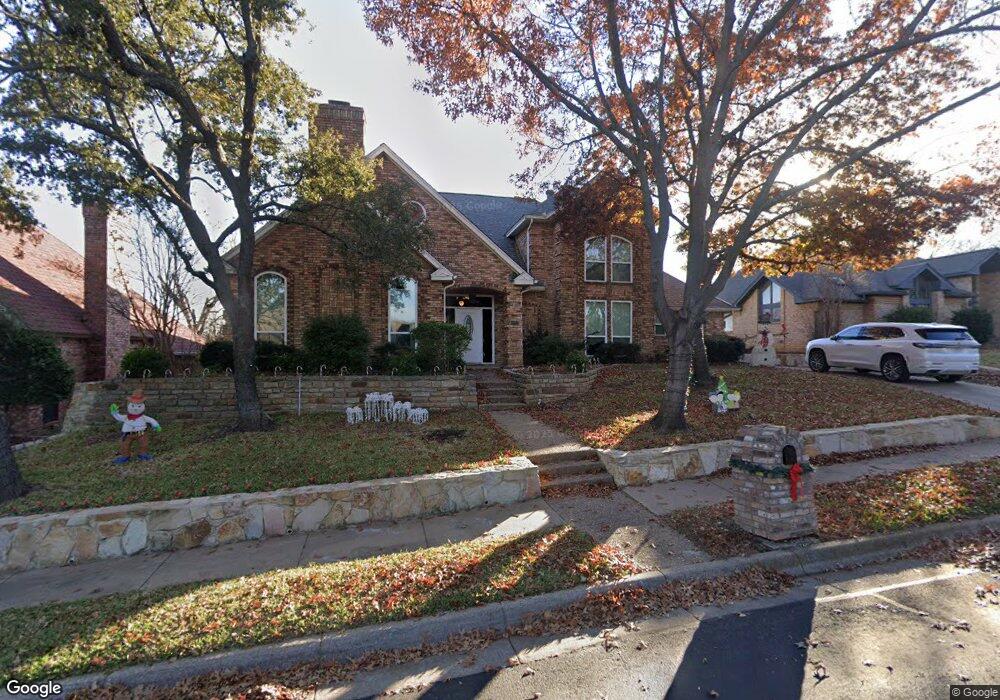
1812 Glenbrook Ct Bedford, TX 76021
Estimated Value: $546,000 - $665,035
5
Beds
3
Baths
3,180
Sq Ft
$190/Sq Ft
Est. Value
About This Home
This home is located at 1812 Glenbrook Ct, Bedford, TX 76021 and is currently estimated at $603,009, approximately $189 per square foot. 1812 Glenbrook Ct is a home located in Tarrant County with nearby schools including Spring Garden Elementary School, Harwood Junior High School, and Trinity High School.
Ownership History
Date
Name
Owned For
Owner Type
Purchase Details
Closed on
Mar 14, 2019
Sold by
Hatfield Jerry
Bought by
Sabodash George C and Sabodash Nikki J
Current Estimated Value
Home Financials for this Owner
Home Financials are based on the most recent Mortgage that was taken out on this home.
Original Mortgage
$306,000
Outstanding Balance
$197,576
Interest Rate
4.4%
Mortgage Type
Purchase Money Mortgage
Estimated Equity
$405,433
Purchase Details
Closed on
Aug 3, 2011
Sold by
Deutsche Bank Trust Company Americas
Bought by
Hatfield Jerry and Hatfield Cheryl
Purchase Details
Closed on
Jan 28, 2011
Sold by
Farish Jerry L
Bought by
Deutsche Bank Trust Company Americas
Purchase Details
Closed on
Oct 7, 1998
Sold by
Farish Jill E
Bought by
Farish Jerry L
Purchase Details
Closed on
Feb 25, 1998
Sold by
Terry Douglas L and Terry Cheryl N
Bought by
Farish Jerry L and Farish Jill E
Home Financials for this Owner
Home Financials are based on the most recent Mortgage that was taken out on this home.
Original Mortgage
$209,090
Interest Rate
7.5%
Mortgage Type
VA
Create a Home Valuation Report for This Property
The Home Valuation Report is an in-depth analysis detailing your home's value as well as a comparison with similar homes in the area
Home Values in the Area
Average Home Value in this Area
Purchase History
| Date | Buyer | Sale Price | Title Company |
|---|---|---|---|
| Sabodash George C | -- | Independence Title Co | |
| Hatfield Jerry | -- | Lsi Title Agency Inc | |
| Deutsche Bank Trust Company Americas | $238,000 | None Available | |
| Farish Jerry L | -- | -- | |
| Farish Jerry L | -- | American Title Company |
Source: Public Records
Mortgage History
| Date | Status | Borrower | Loan Amount |
|---|---|---|---|
| Open | Sabodash George C | $306,000 | |
| Previous Owner | Farish Jerry L | $209,090 |
Source: Public Records
Tax History Compared to Growth
Tax History
| Year | Tax Paid | Tax Assessment Tax Assessment Total Assessment is a certain percentage of the fair market value that is determined by local assessors to be the total taxable value of land and additions on the property. | Land | Improvement |
|---|---|---|---|---|
| 2025 | $9,775 | $666,261 | $100,000 | $566,261 |
| 2024 | $9,775 | $666,261 | $100,000 | $566,261 |
| 2023 | $10,060 | $585,200 | $60,000 | $525,200 |
| 2022 | $10,415 | $552,814 | $60,000 | $492,814 |
| 2021 | $10,211 | $528,262 | $60,000 | $468,262 |
| 2020 | $9,370 | $427,682 | $60,000 | $367,682 |
| 2019 | $8,703 | $425,417 | $60,000 | $365,417 |
| 2018 | $7,530 | $325,683 | $60,000 | $265,683 |
| 2017 | $8,132 | $336,189 | $45,000 | $291,189 |
| 2016 | $7,392 | $320,221 | $45,000 | $275,221 |
| 2015 | $6,701 | $277,800 | $30,000 | $247,800 |
| 2014 | $6,701 | $277,800 | $30,000 | $247,800 |
Source: Public Records
Map
Nearby Homes
- 1800 Hampton Dr
- 3532 Meadowside Dr
- 3513 Meadowside Dr
- 1704 Indian Oaks Ct
- 1636 Bedford Oaks Dr
- 1723 Post Oak Dr
- 1820 Wimbleton Dr
- 2209 Laurel Ct
- 1630 Post Oak Dr
- 22 Lincolnshire Cir
- 37 Devonshire Dr
- 2901 Miles Way
- 3827 Ashbury Ln
- 3840 Edgewater Dr
- 1401 Danielle Dr
- 2220 Tiffany Glenn Ct
- 1209 Hillandale Ct
- 3301 Wendover Ct
- 3152 Woodbridge Dr
- 2909 Oakridge Dr
- 1816 Glenbrook Ct
- 1808 Glenbrook Ct
- 1820 Glenbrook Ct
- 1809 Glenbrook Ct
- 1813 Glenbrook Ct
- 1804 Glenbrook Ct
- 1817 Glenbrook Ct
- 1805 Glenbrook Ct
- 1824 Glenbrook Ct
- 1800 Glenbrook Ct
- 3501 Huntington Ln
- 1821 Glenbrook Ct
- 1801 Glenbrook Ct
- 3500 Huntington Ln
- 1828 Glenbrook Ct
- 3500 Courtney Ln
- 1825 Glenbrook Ct
- 3412 Norman Ln
- 3416 Norman Ln
- 3505 Huntington Ln