Estimated Value: $779,109 - $976,000
4
Beds
3
Baths
2,495
Sq Ft
$346/Sq Ft
Est. Value
About This Home
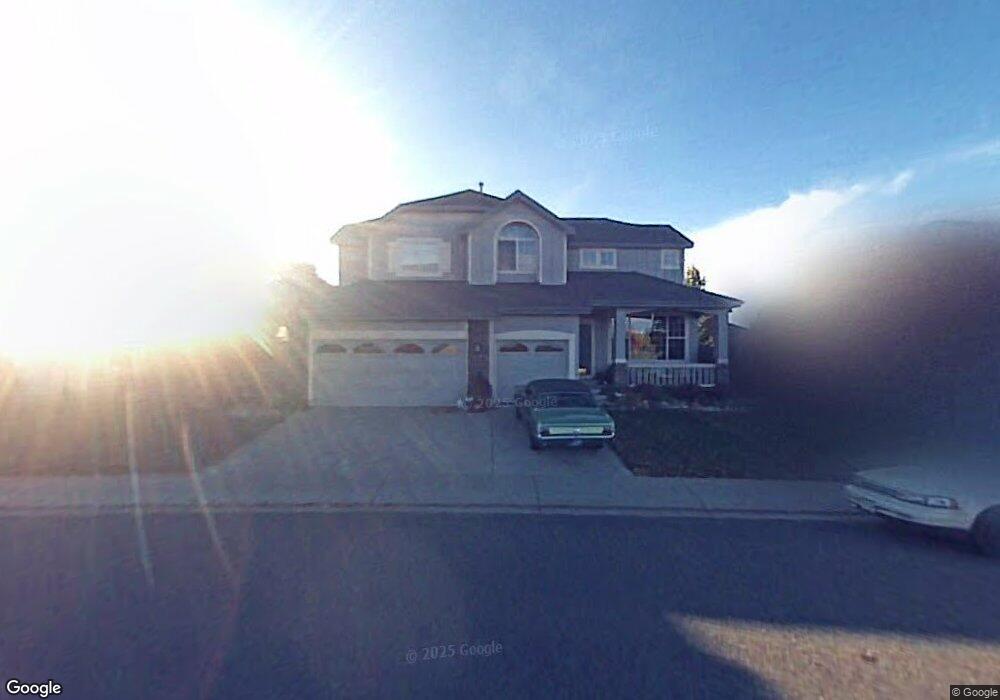
This home is located at 1812 Hauck St, Erie, CO 80516 and is currently estimated at $863,777, approximately $346 per square foot. 1812 Hauck St is a home located in Boulder County with nearby schools including Meadowlark School, Centaurus High School, and Peak to Peak Charter School.
Ownership History
Date
Name
Owned For
Owner Type
Purchase Details
Closed on
Jun 27, 2025
Sold by
Weber Christine M
Bought by
Brian Heneks And Christine Weber Family Livin
Current Estimated Value
Home Financials for this Owner
Home Financials are based on the most recent Mortgage that was taken out on this home.
Original Mortgage
$983,000
Outstanding Balance
$981,339
Interest Rate
6.86%
Mortgage Type
Credit Line Revolving
Estimated Equity
-$117,562
Purchase Details
Closed on
Jan 26, 2023
Sold by
Weber Christine M and Weber Brian
Bought by
Brian Heneks And Christine Weber Family Livin
Purchase Details
Closed on
Dec 19, 2011
Sold by
Weber Christine M and Estate Of Scott Curtis Weber
Bought by
Weber Christine M
Purchase Details
Closed on
Oct 30, 1998
Sold by
Wl Homes Llc
Bought by
Weber Scott C
Home Financials for this Owner
Home Financials are based on the most recent Mortgage that was taken out on this home.
Original Mortgage
$100,000
Interest Rate
6.57%
Create a Home Valuation Report for This Property
The Home Valuation Report is an in-depth analysis detailing your home's value as well as a comparison with similar homes in the area
Home Values in the Area
Average Home Value in this Area
Purchase History
| Date | Buyer | Sale Price | Title Company |
|---|---|---|---|
| Brian Heneks And Christine Weber Family Livin | -- | None Listed On Document | |
| Brian Heneks And Christine Weber Family Livin | -- | -- | |
| Weber Christine M | -- | None Available | |
| Weber Scott C | $247,604 | -- |
Source: Public Records
Mortgage History
| Date | Status | Borrower | Loan Amount |
|---|---|---|---|
| Open | Brian Heneks And Christine Weber Family Livin | $983,000 | |
| Previous Owner | Weber Scott C | $100,000 |
Source: Public Records
Tax History Compared to Growth
Tax History
| Year | Tax Paid | Tax Assessment Tax Assessment Total Assessment is a certain percentage of the fair market value that is determined by local assessors to be the total taxable value of land and additions on the property. | Land | Improvement |
|---|---|---|---|---|
| 2025 | $5,027 | $47,063 | $12,525 | $34,538 |
| 2024 | $5,027 | $47,063 | $12,525 | $34,538 |
| 2023 | $4,955 | $47,630 | $16,670 | $34,646 |
| 2022 | $4,231 | $38,100 | $10,543 | $27,557 |
| 2021 | $4,221 | $39,197 | $10,847 | $28,350 |
| 2020 | $3,928 | $36,144 | $6,793 | $29,351 |
| 2019 | $3,879 | $36,144 | $6,793 | $29,351 |
| 2018 | $3,678 | $33,646 | $9,576 | $24,070 |
| 2017 | $3,459 | $37,197 | $10,587 | $26,610 |
| 2016 | $3,382 | $31,856 | $13,612 | $18,244 |
| 2015 | $3,232 | $26,236 | $7,880 | $18,356 |
| 2014 | $2,720 | $26,236 | $7,880 | $18,356 |
Source: Public Records
Map
Nearby Homes
- 1842 Southard St
- 1321 Alexandria St
- 1305 Balmora St
- 1381 Siltstone St
- 309 Baron Ave
- 304 W Beacon Hill Dr
- 1331 Fountain Ln
- 1195 Fox Hills Ct
- 300 Lucerne Dr
- 803 W Lucerne Dr
- 848 Sandstone Cir
- 951 Vetch Cir
- 2326 Carbonate Cir
- 1063 Sandstone Cir
- 921 Latigo Loop
- 917 Latigo Loop
- 1041 Homestead Rd
- 1920 Marfell St
- 972 Carbonate Ln
- 0 Rainbow Ln
- 1798 Hauck St
- 1826 Hauck St
- 2878 Dickens St
- 1846 MacCullen Dr
- 1850 MacCullen Dr
- 2894 Dickens St
- 1842 Hauck St
- 1852 MacCullen Dr
- 1782 Hauck St
- 1851 MacCullen Dr
- 2908 Dickens St
- 1831 MacCullen Dr
- 1856 Hauck St
- 1856 MacCullen Dr
- 1861 MacCullen Dr
- 2883 Dickens St
- 1821 MacCullen Dr
- 1768 Hauck St
- 2922 Dickens St
- 1870 Hauck St