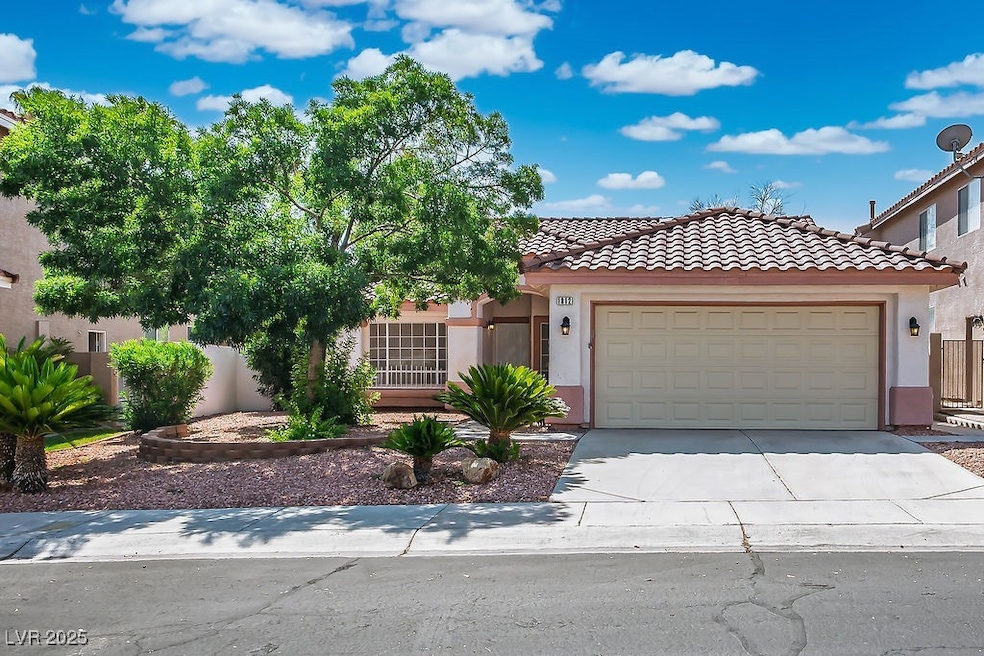
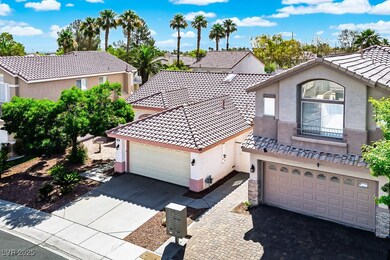
1812 Jack Rabbit Way Las Vegas, NV 89128
Summerlin NeighborhoodEstimated payment $2,800/month
Highlights
- Gated Community
- Skylights
- 2 Car Attached Garage
- Covered Patio or Porch
- Plantation Shutters
- Solar Screens
About This Home
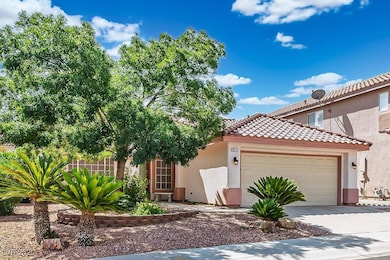
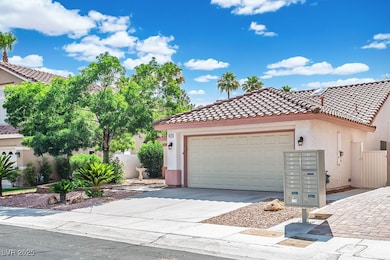
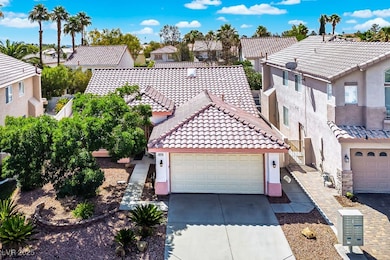
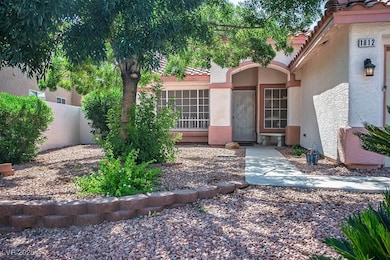
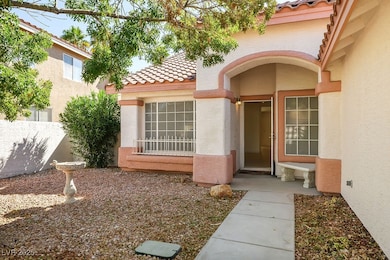
Charming Single-Story Home in a gated Summerlin Community! Welcome to your new home in the sought after Monterrey Este neighborhood, nestled within the vibrant Village of the Pueblos in Summerlin. This beautifully updated single story home offers a blend of comfort, style and location. Just minutes away from top rated schools, shopping, and dining. Take advantage of a private entrance to Pueblo Park, offering scenic walking trails, sports courts and family picnic areas. Step inside to find freshly installed tiles in the living, family room, kitchen, hallways and bathrooms. Freshly painted interior, spacious living with a cozy gas fireplace, perfect for family gatherings. Additional upgrades include new solar screens, newly installed water softener, 3 yr old water heater and a well maintained HVAC .system. Outside, you'll love the generous backyard with a covered patio! Don't miss this incredible opportunity to own a move in ready home!
Listing Agent
City Villa Realty & Management Brokerage Phone: 702-222-0576 License #S.0060127 Listed on: 09/30/2025
Home Details
Home Type
- Single Family
Est. Annual Taxes
- $2,067
Year Built
- Built in 1996
Lot Details
- 5,663 Sq Ft Lot
- North Facing Home
- Back Yard Fenced
- Block Wall Fence
- Drip System Landscaping
- Backyard Sprinklers
HOA Fees
Parking
- 2 Car Attached Garage
- Parking Storage or Cabinetry
- Garage Door Opener
Home Design
- Tile Roof
Interior Spaces
- 1,628 Sq Ft Home
- 1-Story Property
- Ceiling Fan
- Skylights
- Gas Fireplace
- Plantation Shutters
- Blinds
- Solar Screens
- Family Room with Fireplace
Kitchen
- Gas Cooktop
- Microwave
- Disposal
Flooring
- Carpet
- Tile
Bedrooms and Bathrooms
- 3 Bedrooms
- 2 Full Bathrooms
Laundry
- Laundry Room
- Laundry on main level
- Dryer
- Washer
Outdoor Features
- Covered Patio or Porch
Schools
- Bryan Elementary School
- Becker Middle School
- Cimarron-Memorial High School
Utilities
- Central Heating and Cooling System
- Heating System Uses Gas
- Underground Utilities
- Water Softener is Owned
Community Details
Overview
- Association fees include management
- Monterrey Este Owner Association, Phone Number (702) 940-7136
- Monterrey Este Gated Community Subdivision
- The community has rules related to covenants, conditions, and restrictions
Security
- Gated Community
Map
Home Values in the Area
Average Home Value in this Area
Tax History
| Year | Tax Paid | Tax Assessment Tax Assessment Total Assessment is a certain percentage of the fair market value that is determined by local assessors to be the total taxable value of land and additions on the property. | Land | Improvement |
|---|---|---|---|---|
| 2025 | $2,067 | $104,229 | $44,800 | $59,429 |
| 2024 | $2,007 | $104,229 | $44,800 | $59,429 |
| 2023 | $1,638 | $94,123 | $37,450 | $56,673 |
| 2022 | $1,949 | $84,505 | $32,550 | $51,955 |
| 2021 | $1,892 | $76,744 | $27,300 | $49,444 |
| 2020 | $1,834 | $78,912 | $29,750 | $49,162 |
| 2019 | $1,781 | $73,937 | $25,550 | $48,387 |
| 2018 | $1,729 | $68,870 | $22,050 | $46,820 |
| 2017 | $2,226 | $67,863 | $20,300 | $47,563 |
| 2016 | $1,638 | $62,330 | $14,700 | $47,630 |
| 2015 | $1,634 | $55,878 | $11,550 | $44,328 |
| 2014 | $1,586 | $46,919 | $9,800 | $37,119 |
Property History
| Date | Event | Price | List to Sale | Price per Sq Ft |
|---|---|---|---|---|
| 10/29/2025 10/29/25 | Price Changed | $479,000 | -2.1% | $294 / Sq Ft |
| 09/30/2025 09/30/25 | For Sale | $489,500 | -- | $301 / Sq Ft |
Purchase History
| Date | Type | Sale Price | Title Company |
|---|---|---|---|
| Interfamily Deed Transfer | -- | -- | |
| Bargain Sale Deed | $148,000 | National Title Company | |
| Interfamily Deed Transfer | -- | National Title Company | |
| Grant Deed | $144,500 | United Title |
Mortgage History
| Date | Status | Loan Amount | Loan Type |
|---|---|---|---|
| Open | $80,000 | No Value Available | |
| Previous Owner | $115,400 | No Value Available |
Source: Las Vegas REALTORS®
MLS Number: 2722909
APN: 138-21-717-053
Disclaimer: Certain information contained herein is derived from information provided by parties other than Homes.com. All information provided is deemed reliable, but is not guaranteed to be accurate and should be independently verified.
![]() The data relating to real estate for sale on this web site comes in part from the INTERNET DATA EXCHANGE Program of the Greater Las Vegas Association of REALTORS® MLS. Real estate listings held by brokerage firms other than this site owner are marked with the IDX logo. Information is deemed reliable but not guaranteed. Copyright 2025 of the Greater Las Vegas Association of REALTORS® MLS. All rights reserved.
The data relating to real estate for sale on this web site comes in part from the INTERNET DATA EXCHANGE Program of the Greater Las Vegas Association of REALTORS® MLS. Real estate listings held by brokerage firms other than this site owner are marked with the IDX logo. Information is deemed reliable but not guaranteed. Copyright 2025 of the Greater Las Vegas Association of REALTORS® MLS. All rights reserved.
- 7709 Bauble Ave
- 7837 Fort Ruby Place
- 7605 Almeria Ave
- 7608 Haskell Flats Dr
- 1830 N Buffalo Dr Unit 2084
- 1830 N Buffalo Dr Unit 2115
- 1830 N Buffalo Dr Unit 2083
- 7816 Calico Flower Ave
- 7721 Rockfield Dr
- 1909 Desert Falls Ct Unit 206
- 7700 Constanso Ave Unit 204
- 2012 Lady Lake St
- 7721 Constanso Ave Unit 104
- 1909 Villa Palms Ct Unit 109
- 1909 Villa Palms Ct Unit 202
- 2110 Sealion Dr Unit 103
- 1617 Night Breeze Dr
- 7730 Secret Shore Dr Unit 207
- 7720 Secret Shore Dr Unit 207
- 1501 Blackcombe St Unit 202
- 7736 Allerton Ave
- 7640 Sierra Paseo Ln
- 7640 Sierra Paseo Ln
- 7820 Paper Flower Ct
- 7633 W Allano Way
- 1741 Mexican Poppy St
- 1900 Rio Canyon Ct Unit 106
- 7621 Prairie Corners Dr
- 1909 Mountain Hills Ct Unit 205
- 7704 Rockfield Dr
- 1908 High Valley Ct Unit 204
- 1908 High Valley Ct Unit 105
- 1830 N Buffalo Dr Unit 2094
- 1830 N Buffalo Dr Unit 2085
- 1724 Pinion Mesa Ct
- 8004 Verde Springs Dr
- 1901 Desert Falls Ct Unit 206
- 1901 Villa Palms Ct Unit 101
- 8021 Vegas Dr Unit 120
- 7705 Constanso Ave Unit 204
