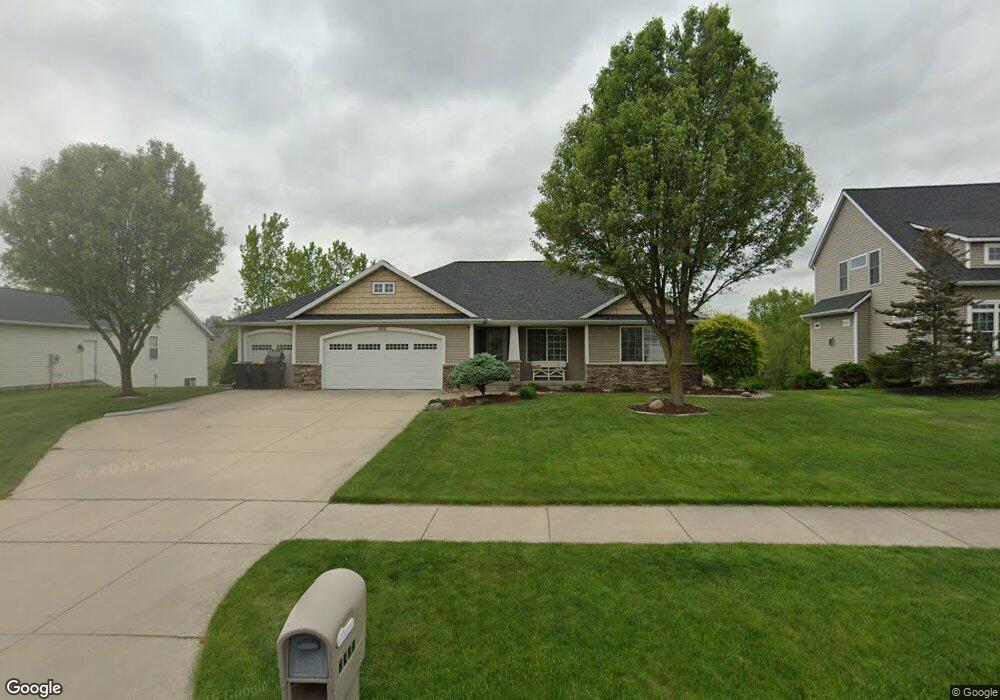
1812 Restoration Dr SW Byron Center, MI 49315
Estimated Value: $392,234 - $548,000
3
Beds
2
Baths
1,520
Sq Ft
$313/Sq Ft
Est. Value
About This Home
This home is located at 1812 Restoration Dr SW, Byron Center, MI 49315 and is currently estimated at $475,059, approximately $312 per square foot. 1812 Restoration Dr SW is a home located in Kent County with nearby schools including Robert L. Nickels Intermediate School, Countryside Elementary School, and Byron Center West Middle School.
Ownership History
Date
Name
Owned For
Owner Type
Purchase Details
Closed on
Mar 1, 2006
Sold by
Gady Jason M and Schiele Gady Melanie A
Bought by
Gady Jason M and Schiele Gady Melanie A
Current Estimated Value
Purchase Details
Closed on
May 27, 2005
Sold by
Crystal Creek Custom Homes Llc
Bought by
Gady Jason M and Schiele Gady Melanie A
Home Financials for this Owner
Home Financials are based on the most recent Mortgage that was taken out on this home.
Original Mortgage
$166,500
Outstanding Balance
$87,761
Interest Rate
5.91%
Mortgage Type
Fannie Mae Freddie Mac
Estimated Equity
$387,298
Purchase Details
Closed on
Nov 23, 2004
Sold by
Jcb Development Llc
Bought by
Crystal Creek Custom Homes Llc
Create a Home Valuation Report for This Property
The Home Valuation Report is an in-depth analysis detailing your home's value as well as a comparison with similar homes in the area
Home Values in the Area
Average Home Value in this Area
Purchase History
| Date | Buyer | Sale Price | Title Company |
|---|---|---|---|
| Gady Jason M | -- | None Available | |
| Gady Jason M | $219,500 | Fatic | |
| Crystal Creek Custom Homes Llc | $102,000 | -- |
Source: Public Records
Mortgage History
| Date | Status | Borrower | Loan Amount |
|---|---|---|---|
| Open | Gady Jason M | $166,500 |
Source: Public Records
Tax History Compared to Growth
Tax History
| Year | Tax Paid | Tax Assessment Tax Assessment Total Assessment is a certain percentage of the fair market value that is determined by local assessors to be the total taxable value of land and additions on the property. | Land | Improvement |
|---|---|---|---|---|
| 2025 | $2,619 | $189,700 | $0 | $0 |
| 2024 | $2,619 | $175,400 | $0 | $0 |
| 2023 | $2,504 | $154,900 | $0 | $0 |
| 2022 | $3,490 | $141,000 | $0 | $0 |
| 2021 | $3,397 | $131,400 | $0 | $0 |
| 2020 | $2,305 | $127,700 | $0 | $0 |
| 2019 | $3,315 | $126,100 | $0 | $0 |
| 2018 | $3,247 | $122,900 | $24,000 | $98,900 |
| 2017 | $3,159 | $114,600 | $0 | $0 |
| 2016 | $3,051 | $108,700 | $0 | $0 |
| 2015 | $2,999 | $108,700 | $0 | $0 |
| 2013 | -- | $96,200 | $0 | $0 |
Source: Public Records
Map
Nearby Homes
- 1941 Conifer Ridge Dr SW
- 1861 Restoration Dr SW
- 1768 Hightree Dr SW
- 8695 Bethany Dr SW
- 8652 Bethany Dr SW
- 8638 Bethany Dr SW
- 8608 Woodruff Dr SW
- 2156 Center Grange Dr
- 1666 Bayleaf Dr
- 1664 Thyme Dr
- 2267 Aimie Ave SW
- The Fitzgerald Plan at Walnut Ridge
- The Marley Plan at Walnut Ridge
- The Hearthside Plan at Walnut Ridge
- The Balsam Plan at Walnut Ridge
- The Rutherford Plan at Walnut Ridge
- The Stockton Plan at Walnut Ridge
- The Georgetown Plan at Walnut Ridge
- The Mayfair Plan at Walnut Ridge
- The Birkshire II Plan at Walnut Ridge
- 1818 Restoration Dr SW
- 1806 Restoration Dr SW
- 8867 Heirloom Dr SW
- 1800 Restoration Dr SW
- 1817 Restoration Dr SW
- 1830 Restoration Dr SW
- 1825 Restoration Dr SW
- 1788 Restoration Dr SW
- 1797 Restoration Dr SW
- 1945 Conifer Ridge Dr SW
- 1957 Conifer Ridge Dr SW
- 1831 Restoration Dr SW
- 1933 Conifer Ridge Dr SW
- 1838 Restoration Dr SW
- 8855 Heirloom Dr SW
- 1839 Restoration Dr SW
- 1965 Conifer Ridge Dr SW
- 1785 Restoration Dr SW
- 1925 Conifer Ridge Dr SW
- 1770 Restoration Dr SW