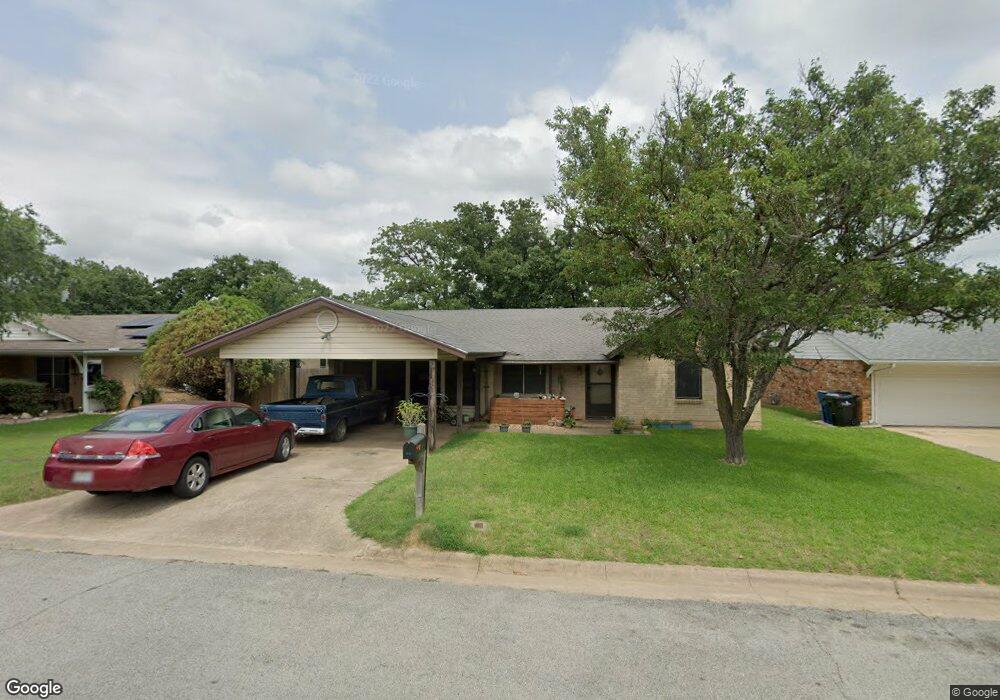
1812 S Center St Denison, TX 75021
Estimated Value: $203,191 - $221,000
3
Beds
2
Baths
1,742
Sq Ft
$122/Sq Ft
Est. Value
About This Home
This home is located at 1812 S Center St, Denison, TX 75021 and is currently estimated at $212,096, approximately $121 per square foot. 1812 S Center St is a home located in Grayson County with nearby schools including Lamar Elementary School, Scott Middle School, and Denison High School.
Ownership History
Date
Name
Owned For
Owner Type
Purchase Details
Closed on
Oct 16, 2020
Sold by
K & M Preston Road Properties Inc
Bought by
Rwm Properties Inc
Current Estimated Value
Purchase Details
Closed on
May 5, 2014
Sold by
Dye Ben
Bought by
K & M Preston Road Properties Inc
Purchase Details
Closed on
Aug 26, 2013
Sold by
Cruz Alyssa and Cruz Angel
Bought by
Dye Ben
Purchase Details
Closed on
Aug 29, 2011
Sold by
Dye Ben
Bought by
Cruz Alyssa and Cruz Angel
Home Financials for this Owner
Home Financials are based on the most recent Mortgage that was taken out on this home.
Original Mortgage
$78,000
Interest Rate
4.53%
Mortgage Type
Seller Take Back
Purchase Details
Closed on
Aug 26, 2011
Sold by
Sanders Nicholas L and Sanders Tammy R
Bought by
Dye Ben
Home Financials for this Owner
Home Financials are based on the most recent Mortgage that was taken out on this home.
Original Mortgage
$78,000
Interest Rate
4.53%
Mortgage Type
Seller Take Back
Create a Home Valuation Report for This Property
The Home Valuation Report is an in-depth analysis detailing your home's value as well as a comparison with similar homes in the area
Home Values in the Area
Average Home Value in this Area
Purchase History
| Date | Buyer | Sale Price | Title Company |
|---|---|---|---|
| Rwm Properties Inc | -- | None Available | |
| K & M Preston Road Properties Inc | -- | None Available | |
| Dye Ben | -- | None Available | |
| Cruz Alyssa | -- | None Available | |
| Dye Ben | -- | Chapin Title Co Inc |
Source: Public Records
Mortgage History
| Date | Status | Borrower | Loan Amount |
|---|---|---|---|
| Previous Owner | Cruz Alyssa | $78,000 |
Source: Public Records
Tax History Compared to Growth
Tax History
| Year | Tax Paid | Tax Assessment Tax Assessment Total Assessment is a certain percentage of the fair market value that is determined by local assessors to be the total taxable value of land and additions on the property. | Land | Improvement |
|---|---|---|---|---|
| 2025 | $4,079 | $182,040 | $35,369 | $146,671 |
| 2024 | $4,079 | $175,587 | $29,312 | $146,275 |
| 2023 | $3,767 | $166,267 | $29,312 | $136,955 |
| 2022 | $3,364 | $141,602 | $29,312 | $112,290 |
| 2021 | $3,272 | $129,749 | $14,203 | $115,546 |
| 2020 | $3,122 | $118,356 | $14,203 | $104,153 |
| 2019 | $3,352 | $121,806 | $9,330 | $112,476 |
| 2018 | $3,139 | $113,167 | $9,330 | $103,837 |
| 2017 | $2,852 | $101,949 | $9,330 | $92,619 |
| 2016 | $3,213 | $100,483 | $9,330 | $91,153 |
| 2015 | $2,449 | $86,689 | $5,918 | $80,771 |
| 2014 | $2,204 | $78,016 | $5,918 | $72,098 |
Source: Public Records
Map
Nearby Homes
- 1901 S Lamar Ave
- 1903 S Lamar Ave
- 1905 S Lamar Ave
- 721 E Bullock St
- TBD Bells Dr
- 705 E Hanna St
- 732 E Bullock St
- 715 E Hanna St
- 153 Circle Dr
- TBD E Heron St
- 1414 S Houston Ave
- 621 E Murray St
- 174 Circle Dr
- 622 E Heron St
- 401 E Monterey St
- 101 E Murray St
- 415 E Monterey St
- 111 W Murray St
- 609 E Monterey St
- TBD S Austin Ave
- 1806 S Center St
- 1818 S Center St
- 1826 S Center St
- 1800 S Center St
- 1813 S Center St
- 1819 S Center St
- 1807 S Center St
- 1830 S Center St
- 1730 S Center St
- 1825 S Center St
- 1801 S Center St
- 1731 S Center St
- 1829 S Center St
- 1722 S Center St
- 1812 S Travis Ave
- 1806 S Travis Ave
- 1818 S Travis Ave
- 1826 S Travis Ave
- 1800 S Travis Ave
- 1723 S Center St