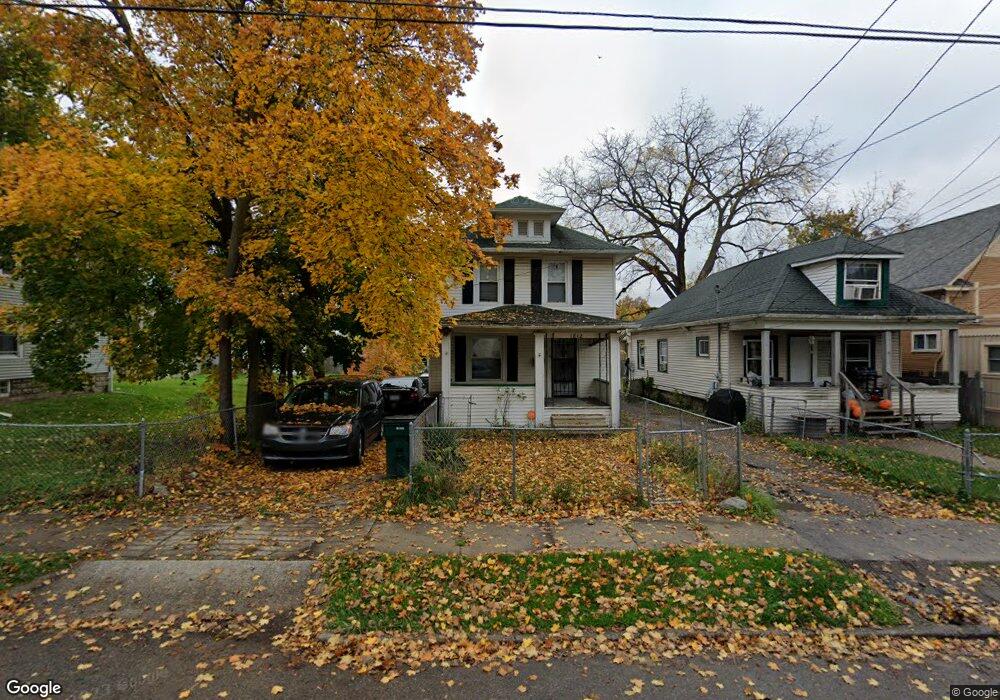
1812 Teel Ave Lansing, MI 48910
Fabulous Acres NeighborhoodEstimated Value: $97,000 - $122,487
2
Beds
1
Bath
1,160
Sq Ft
$93/Sq Ft
Est. Value
About This Home
This home is located at 1812 Teel Ave, Lansing, MI 48910 and is currently estimated at $108,122, approximately $93 per square foot. 1812 Teel Ave is a home located in Ingham County with nearby schools including Lyons Elementary School, Pattengill Academy, and Eastern High School.
Ownership History
Date
Name
Owned For
Owner Type
Purchase Details
Closed on
Dec 20, 2007
Sold by
Kenny Cynthia L and Henton Joe
Bought by
Chase Bank Usa Na
Current Estimated Value
Purchase Details
Closed on
Apr 3, 2006
Sold by
Henton Cynthia L and Kenney Cynthia L
Bought by
Henton Joe B and Henton Cynthia L
Home Financials for this Owner
Home Financials are based on the most recent Mortgage that was taken out on this home.
Original Mortgage
$73,000
Interest Rate
6.37%
Mortgage Type
Stand Alone Refi Refinance Of Original Loan
Purchase Details
Closed on
Apr 17, 1996
Sold by
Cook Emerald and Cook Barbara
Bought by
Kenney Cynthia L
Create a Home Valuation Report for This Property
The Home Valuation Report is an in-depth analysis detailing your home's value as well as a comparison with similar homes in the area
Home Values in the Area
Average Home Value in this Area
Purchase History
| Date | Buyer | Sale Price | Title Company |
|---|---|---|---|
| Chase Bank Usa Na | $75,000 | None Available | |
| Henton Joe B | -- | None Available | |
| Kenney Cynthia L | $46,000 | -- |
Source: Public Records
Mortgage History
| Date | Status | Borrower | Loan Amount |
|---|---|---|---|
| Previous Owner | Henton Joe B | $73,000 |
Source: Public Records
Tax History Compared to Growth
Tax History
| Year | Tax Paid | Tax Assessment Tax Assessment Total Assessment is a certain percentage of the fair market value that is determined by local assessors to be the total taxable value of land and additions on the property. | Land | Improvement |
|---|---|---|---|---|
| 2025 | $1,833 | $51,800 | $2,900 | $48,900 |
| 2024 | $14 | $39,600 | $2,900 | $36,700 |
| 2023 | $1,721 | $35,200 | $2,900 | $32,300 |
| 2022 | $1,555 | $32,800 | $2,400 | $30,400 |
| 2021 | $1,523 | $29,800 | $2,300 | $27,500 |
| 2020 | $1,513 | $27,900 | $2,300 | $25,600 |
| 2019 | $2,512 | $25,300 | $2,300 | $23,000 |
| 2018 | $1,360 | $22,600 | $2,300 | $20,300 |
| 2017 | $1,301 | $22,600 | $2,300 | $20,300 |
| 2016 | $2,296 | $22,200 | $2,300 | $19,900 |
| 2015 | $2,296 | $21,700 | $4,676 | $17,024 |
| 2014 | $2,296 | $22,000 | $3,597 | $18,403 |
Source: Public Records
Map
Nearby Homes
- 1722 S Washington Ave
- 147 Isbell St
- 1800 Herbert St
- 1927 Teel Ave
- 1731 Herbert St
- 2107 Teel Ave
- 525 E Mount Hope Ave
- 1818 Ray St
- 139 Woodlawn Ave
- 202 Woodlawn Ave
- 1408 Reo Ave
- 1406 Reo Ave
- 2230 Maplewood Ave
- 520 Riley St
- 531 Torrence Ct
- 506 Christiancy St
- 515 Jason Ct
- 511 W Mount Hope Ave
- 1539 Linval St
- 1723 Osband Ave
- 1808 Teel Ave
- 1818 Teel Ave
- 1806 Teel Ave
- 1804 Teel Ave
- 1822 Teel Ave
- 1800 Teel Ave
- 121 E Mount Hope Ave
- 125 E Mount Hope Ave
- 113 E Mount Hope Ave
- 127 E Mount Hope Ave
- 1900 Teel Ave
- 1732 Teel Ave
- 1815 Teel Ave
- 1823 Teel Ave
- 1811 Teel Ave
- 1803 Teel Ave
- 1807 Teel Ave
- 1819 Teel Ave
- 1919 S Washington Ave
- 201 E Mount Hope Ave