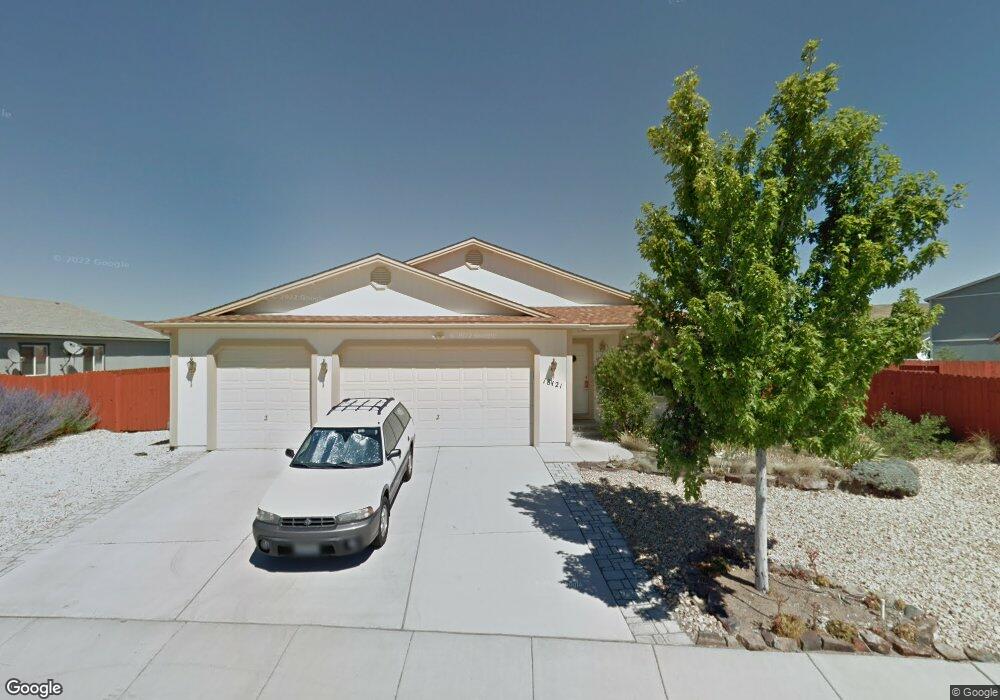
18121 Alexandria Dr Reno, NV 89508
Cold Springs NeighborhoodEstimated Value: $428,000 - $464,000
3
Beds
2
Baths
1,777
Sq Ft
$252/Sq Ft
Est. Value
About This Home
This home is located at 18121 Alexandria Dr, Reno, NV 89508 and is currently estimated at $446,969, approximately $251 per square foot. 18121 Alexandria Dr is a home located in Washoe County with nearby schools including Cold Springs Middle Schools and North Valleys High School.
Ownership History
Date
Name
Owned For
Owner Type
Purchase Details
Closed on
Oct 18, 2016
Sold by
Peterson Newton
Bought by
Peterson Newton and Peterson Living Trust
Current Estimated Value
Purchase Details
Closed on
Dec 16, 2010
Sold by
Peterson Newton
Bought by
Peterson Newton
Home Financials for this Owner
Home Financials are based on the most recent Mortgage that was taken out on this home.
Original Mortgage
$150,658
Interest Rate
4.17%
Mortgage Type
New Conventional
Purchase Details
Closed on
Oct 17, 2007
Sold by
Petersdorf Kelly
Bought by
Peterson Newton
Home Financials for this Owner
Home Financials are based on the most recent Mortgage that was taken out on this home.
Original Mortgage
$157,000
Interest Rate
6.27%
Mortgage Type
New Conventional
Purchase Details
Closed on
Mar 14, 2003
Sold by
Woodland Village 2002 Llc
Bought by
Peterson Newton
Home Financials for this Owner
Home Financials are based on the most recent Mortgage that was taken out on this home.
Original Mortgage
$150,220
Interest Rate
5.83%
Mortgage Type
FHA
Create a Home Valuation Report for This Property
The Home Valuation Report is an in-depth analysis detailing your home's value as well as a comparison with similar homes in the area
Home Values in the Area
Average Home Value in this Area
Purchase History
| Date | Buyer | Sale Price | Title Company |
|---|---|---|---|
| Peterson Newton | -- | None Available | |
| Peterson Newton | -- | Ticor Title Reno | |
| Peterson Newton | -- | First American Title Reno | |
| Peterson Newton | $159,227 | First American Title |
Source: Public Records
Mortgage History
| Date | Status | Borrower | Loan Amount |
|---|---|---|---|
| Previous Owner | Peterson Newton | $150,658 | |
| Previous Owner | Peterson Newton | $157,000 | |
| Previous Owner | Peterson Newton | $150,220 |
Source: Public Records
Tax History Compared to Growth
Tax History
| Year | Tax Paid | Tax Assessment Tax Assessment Total Assessment is a certain percentage of the fair market value that is determined by local assessors to be the total taxable value of land and additions on the property. | Land | Improvement |
|---|---|---|---|---|
| 2025 | $1,587 | $103,306 | $33,320 | $69,986 |
| 2024 | $1,541 | $97,458 | $27,020 | $70,438 |
| 2023 | $1,541 | $93,180 | $31,080 | $62,100 |
| 2022 | $1,496 | $77,925 | $26,250 | $51,675 |
| 2021 | $1,453 | $72,387 | $21,035 | $51,352 |
| 2020 | $1,409 | $71,551 | $20,125 | $51,426 |
| 2019 | $1,367 | $68,641 | $18,970 | $49,671 |
| 2018 | $1,328 | $62,348 | $13,755 | $48,593 |
| 2017 | $1,289 | $61,212 | $12,565 | $48,647 |
| 2016 | $1,257 | $60,856 | $11,410 | $49,446 |
| 2015 | $1,254 | $57,868 | $9,275 | $48,593 |
| 2014 | $1,215 | $45,000 | $7,420 | $37,580 |
| 2013 | -- | $36,403 | $5,250 | $31,153 |
Source: Public Records
Map
Nearby Homes
- 18197 Almondleaf Ct
- 17710 Fairfax Ct
- 18119 Cherryleaf Ct
- 17795 Oakview Ct
- 17870 Fairfax Ct
- 18204 Cedar View Dr
- 18260 Alderwood Ct
- 4040 Goldfinch Dr
- 17507 Bear Lake Dr
- 17640 Lake Powell Dr
- 18520 Silverbell Ct
- 17855 Blackbird Dr
- 17533 Javalina Ct
- Home Plan 1731 at Woodland Village
- Home Plan 2291 at Woodland Village
- Home Plan 1977 at Woodland Village
- Home Plan 2304 at Woodland Village
- 17862 Bear River Ct
- 17523 Javalina Ct
- 115 Calistoga Ct
- 18127 Alexandria Dr
- 18115 Alexandria Dr
- 18107 Alexandria Dr
- 18202 Almondleaf Ct
- 18208 Almondleaf Ct
- 18196 Almondleaf Ct
- 17604 Thomasville Ct
- 18214 Almondleaf Ct
- 17605 Thomasville Ct
- 18139 Alexandria Dr
- 18190 Almondleaf Ct
- 18220 Almondleaf Ct
- 18101 Alexandria Dr
- 17614 Thomasville Ct
- 17614 Thomasville Ct Unit 1
- 17605 Alexandria Ct
- 17615 Thomasville Ct
- 18203 Almondleaf Ct
- 18209 Almondleaf Ct
- 17614 Mayfield Ct