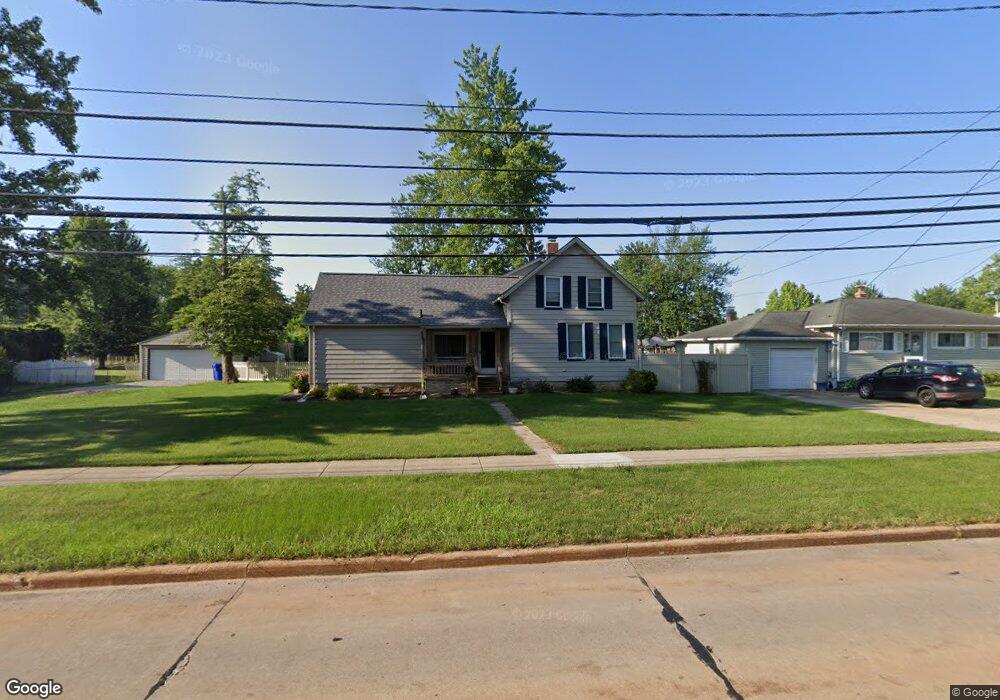
18125 Holland Rd Brookpark, OH 44142
Estimated Value: $232,828 - $251,000
5
Beds
1
Bath
2,228
Sq Ft
$109/Sq Ft
Est. Value
About This Home
This home is located at 18125 Holland Rd, Brookpark, OH 44142 and is currently estimated at $243,457, approximately $109 per square foot. 18125 Holland Rd is a home located in Cuyahoga County with nearby schools including Berea-Midpark Middle School, Berea-Midpark High School, and Huber Heights Preparatory Academy Parma Academy.
Ownership History
Date
Name
Owned For
Owner Type
Purchase Details
Closed on
Apr 15, 2008
Sold by
Zelinski Dale J and Zelinski Dale Z
Bought by
Zelinski Dale J and Zelinski Deborah M
Current Estimated Value
Purchase Details
Closed on
Sep 24, 1984
Sold by
Whitmire Billie J
Bought by
Zelinski Dale Z
Purchase Details
Closed on
May 30, 1978
Sold by
Sal Patricia
Bought by
Whitmire Billie J
Purchase Details
Closed on
Jul 22, 1977
Sold by
Sal Robert and Sal Patricia
Bought by
Sal Patricia
Purchase Details
Closed on
Jan 1, 1975
Bought by
Sal Robert and Sal Patricia
Create a Home Valuation Report for This Property
The Home Valuation Report is an in-depth analysis detailing your home's value as well as a comparison with similar homes in the area
Home Values in the Area
Average Home Value in this Area
Purchase History
| Date | Buyer | Sale Price | Title Company |
|---|---|---|---|
| Zelinski Dale J | -- | Attorney | |
| Zelinski Dale Z | $38,000 | -- | |
| Whitmire Billie J | $20,000 | -- | |
| Sal Patricia | -- | -- | |
| Sal Robert | -- | -- |
Source: Public Records
Tax History Compared to Growth
Tax History
| Year | Tax Paid | Tax Assessment Tax Assessment Total Assessment is a certain percentage of the fair market value that is determined by local assessors to be the total taxable value of land and additions on the property. | Land | Improvement |
|---|---|---|---|---|
| 2024 | $2,904 | $57,575 | $16,730 | $40,845 |
| 2023 | $3,304 | $54,250 | $15,260 | $38,990 |
| 2022 | $3,281 | $54,250 | $15,260 | $38,990 |
| 2021 | $3,262 | $54,250 | $15,260 | $38,990 |
| 2020 | $3,009 | $43,050 | $12,110 | $30,940 |
| 2019 | $2,921 | $123,000 | $34,600 | $88,400 |
| 2018 | $2,657 | $43,050 | $12,110 | $30,940 |
| 2017 | $2,600 | $35,530 | $10,430 | $25,100 |
| 2016 | $2,579 | $35,530 | $10,430 | $25,100 |
| 2015 | $2,551 | $35,530 | $10,430 | $25,100 |
| 2014 | $2,551 | $37,380 | $10,990 | $26,390 |
Source: Public Records
Map
Nearby Homes
- 6401 Scott Dr
- 6409 Scott Dr
- 6465 Claudia Dr
- 6366 Sandhurst Dr
- 6421 Sylvia Dr
- 5966 Engle Rd
- 6054 Langer Dr
- 6728 Benedict Dr
- 6740 Benedict Dr
- 6755 Benedict Dr
- 16310 Richard Dr
- 6748 Benedict Dr
- 6744 Benedict Dr
- 6720 Benedict Dr
- 6724 Benedict Dr
- 16051 Holland Rd
- 15800 Holland Rd
- 16761 Orchard Grove Dr Unit 6808A
- 6470 Sandfield Dr
- 6736 Columbine Ct
- 18161 Holland Rd
- 18085 Holland Rd
- 18185 Holland Rd
- 18050 Kalvin Dr
- 18040 Kalvin Dr
- 18160 Kalvin Dr
- 18009 Holland Rd
- 18209 Holland Rd
- 18184 Kalvin Dr
- 18208 Kalvin Dr
- 18184 Holland Rd
- 18010 Kalvin Dr
- 17973 Holland Rd
- 18100 Holland Rd
- 18210 Holland Rd
- 18186 Holland Rd
- 18058 Holland Rd
- 17974 Kalvin Dr
- 18257 Holland Rd
- 17955 Holland Rd