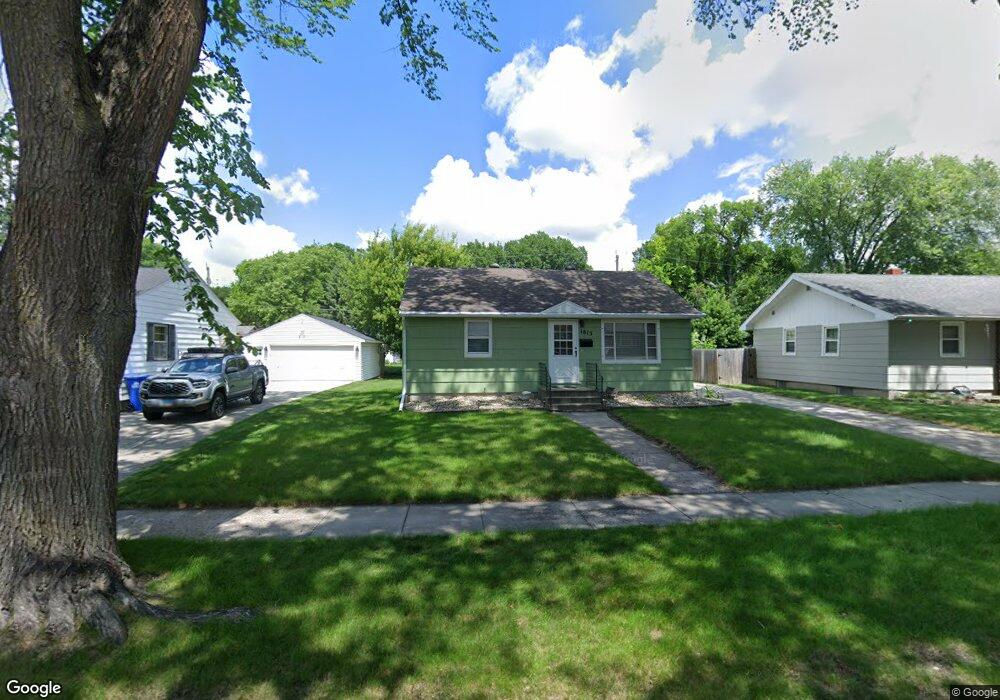
1813 12th Ave S Fargo, ND 58103
Jefferson-Carl NeighborhoodEstimated Value: $184,000 - $215,000
2
Beds
1
Bath
832
Sq Ft
$244/Sq Ft
Est. Value
About This Home
This home is located at 1813 12th Ave S, Fargo, ND 58103 and is currently estimated at $203,001, approximately $243 per square foot. 1813 12th Ave S is a home located in Cass County with nearby schools including Jefferson Elementary School, Carl Ben Eielson Middle School, and South High School.
Ownership History
Date
Name
Owned For
Owner Type
Purchase Details
Closed on
May 3, 2022
Sold by
Barry Steven and Barry Lisa
Bought by
Barry Steven
Current Estimated Value
Purchase Details
Closed on
Jun 15, 2018
Sold by
Thomas Bruce and Thoms Jane W
Bought by
Varry Steven K and Varry Lisa A
Home Financials for this Owner
Home Financials are based on the most recent Mortgage that was taken out on this home.
Original Mortgage
$143,355
Interest Rate
4.25%
Mortgage Type
FHA
Purchase Details
Closed on
May 30, 2014
Sold by
Hicks Aaron G
Bought by
Thomas Bruce and Thomas Jane W
Purchase Details
Closed on
Sep 14, 2009
Sold by
Wamer Blake T and Wamer Alyssa L
Bought by
Hickes Aaron G
Home Financials for this Owner
Home Financials are based on the most recent Mortgage that was taken out on this home.
Original Mortgage
$115,842
Interest Rate
5.05%
Mortgage Type
FHA
Purchase Details
Closed on
Oct 7, 2005
Sold by
Fillner Albert F and Fillner Mavis R
Bought by
Klever Alyssa L and Wanner Blake T
Home Financials for this Owner
Home Financials are based on the most recent Mortgage that was taken out on this home.
Original Mortgage
$103,600
Interest Rate
5.83%
Mortgage Type
FHA
Create a Home Valuation Report for This Property
The Home Valuation Report is an in-depth analysis detailing your home's value as well as a comparison with similar homes in the area
Home Values in the Area
Average Home Value in this Area
Purchase History
| Date | Buyer | Sale Price | Title Company |
|---|---|---|---|
| Barry Steven | -- | -- | |
| Varry Steven K | $145,000 | Fm Title | |
| Thomas Bruce | $125,000 | None Available | |
| Hickes Aaron G | -- | -- | |
| Klever Alyssa L | -- | -- |
Source: Public Records
Mortgage History
| Date | Status | Borrower | Loan Amount |
|---|---|---|---|
| Previous Owner | Varry Steven K | $143,355 | |
| Previous Owner | Hickes Aaron G | $115,842 | |
| Previous Owner | Klever Alyssa L | $103,600 |
Source: Public Records
Tax History Compared to Growth
Tax History
| Year | Tax Paid | Tax Assessment Tax Assessment Total Assessment is a certain percentage of the fair market value that is determined by local assessors to be the total taxable value of land and additions on the property. | Land | Improvement |
|---|---|---|---|---|
| 2024 | $2,065 | $93,550 | $21,050 | $72,500 |
| 2023 | $2,455 | $89,950 | $21,050 | $68,900 |
| 2022 | $2,407 | $86,500 | $21,050 | $65,450 |
| 2021 | $2,063 | $75,200 | $21,050 | $54,150 |
| 2020 | $2,053 | $75,200 | $21,050 | $54,150 |
| 2019 | $1,886 | $69,400 | $12,500 | $56,900 |
| 2018 | $1,862 | $69,400 | $12,500 | $56,900 |
| 2017 | $1,792 | $67,400 | $12,500 | $54,900 |
| 2016 | $1,581 | $65,450 | $12,500 | $52,950 |
| 2015 | $1,687 | $65,550 | $8,550 | $57,000 |
| 2014 | $1,604 | $60,700 | $8,550 | $52,150 |
| 2013 | $1,515 | $57,800 | $8,550 | $49,250 |
Source: Public Records
Map
Nearby Homes
- 1709 13th Ave S
- 2009 13th Ave S
- 2013 13th Ave S
- 1301 16 1 2 St S
- 1637 10th Ave S
- 1129 22nd St S Unit B09
- 1129 22nd St S Unit B12
- 818 19th St S
- 814 19th St S
- 1407 17th St S
- 813 17th St S
- 1517 9th Ave S
- 1418 11th Ave S
- 1418 12th Ave S
- 1414 10th Ave S
- 2202 15th Ave S
- 1410 14 1 2 St S
- 1314 14th St S
- 2209 6th Ave S
- 2126 5th Ave S
- 1817 12th Ave S
- 1809 12th Ave S
- 1814 11th Ave S
- 1901 12th Ave S
- 1818 11th Ave S
- 1810 11th Ave S
- 1109 18th St S
- 1109 18th St S
- 1902 11th Ave S
- 1806 11th Ave S
- 1814 12th Ave S
- 1905 12th Ave S
- 1810 12th Ave S
- 1802 11th Ave S
- 1906 11th Ave S
- 1806 12th Ave S
- 1902 12th Ave S
- 1909 12th Ave S
- 1906 12th Ave S
- 1910 11th Ave S