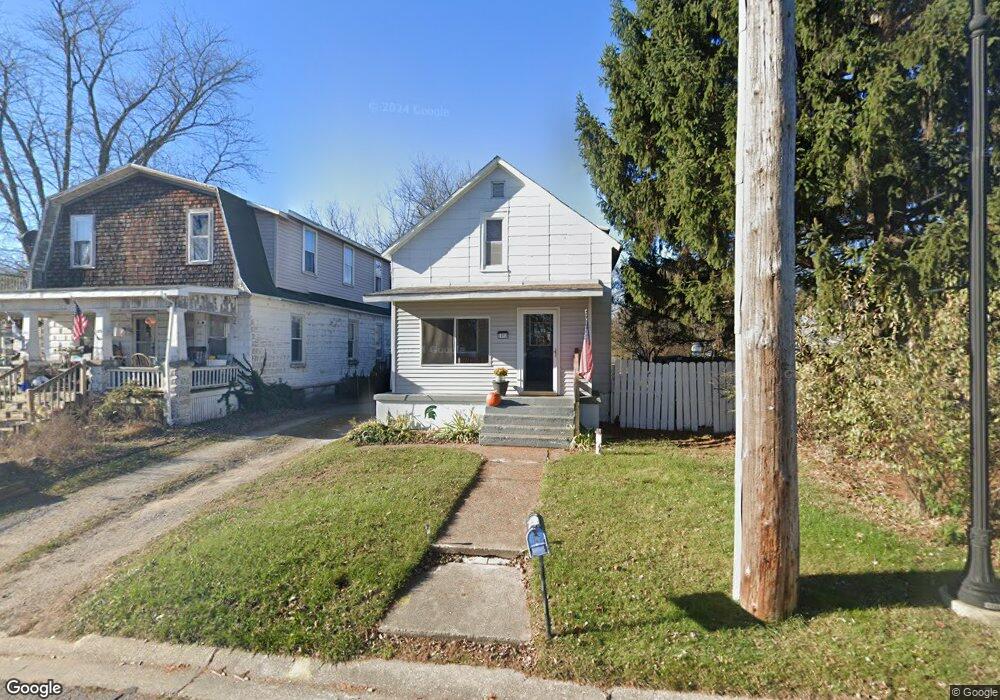
1813 27th St Port Huron, MI 48060
Estimated Value: $99,000 - $144,000
--
Bed
--
Bath
1,143
Sq Ft
$112/Sq Ft
Est. Value
About This Home
This home is located at 1813 27th St, Port Huron, MI 48060 and is currently estimated at $128,151, approximately $112 per square foot. 1813 27th St is a home located in St. Clair County with nearby schools including Michigamme Elementary School, Central Middle School, and Port Huron High School.
Ownership History
Date
Name
Owned For
Owner Type
Purchase Details
Closed on
Jul 14, 2008
Sold by
Booker Vernon R and Booker Mary E
Bought by
Booker Vernon R and Booker Mary E
Current Estimated Value
Home Financials for this Owner
Home Financials are based on the most recent Mortgage that was taken out on this home.
Original Mortgage
$71,725
Outstanding Balance
$43,698
Interest Rate
5%
Mortgage Type
Adjustable Rate Mortgage/ARM
Estimated Equity
$84,453
Purchase Details
Closed on
Jun 10, 2005
Sold by
Heidennch Jeffrey S
Bought by
Lasale Bank Na
Create a Home Valuation Report for This Property
The Home Valuation Report is an in-depth analysis detailing your home's value as well as a comparison with similar homes in the area
Home Values in the Area
Average Home Value in this Area
Purchase History
| Date | Buyer | Sale Price | Title Company |
|---|---|---|---|
| Booker Vernon R | -- | None Available | |
| Booker Vernon R | $75,500 | None Available | |
| Lasale Bank Na | $47,024 | None Available |
Source: Public Records
Mortgage History
| Date | Status | Borrower | Loan Amount |
|---|---|---|---|
| Open | Booker Vernon R | $71,725 |
Source: Public Records
Tax History Compared to Growth
Tax History
| Year | Tax Paid | Tax Assessment Tax Assessment Total Assessment is a certain percentage of the fair market value that is determined by local assessors to be the total taxable value of land and additions on the property. | Land | Improvement |
|---|---|---|---|---|
| 2025 | $1,326 | $50,800 | $0 | $0 |
| 2024 | $555 | $49,400 | $0 | $0 |
| 2023 | $512 | $38,400 | $0 | $0 |
| 2022 | $947 | $30,400 | $0 | $0 |
| 2021 | $998 | $26,300 | $0 | $0 |
| 2020 | $998 | $29,900 | $29,900 | $0 |
| 2019 | $1,208 | $26,600 | $0 | $0 |
| 2018 | $1,129 | $26,600 | $0 | $0 |
| 2017 | $1,064 | $25,800 | $0 | $0 |
| 2016 | $430 | $25,800 | $0 | $0 |
| 2015 | -- | $25,800 | $25,800 | $0 |
| 2014 | -- | $24,200 | $24,200 | $0 |
| 2013 | -- | $23,900 | $0 | $0 |
Source: Public Records
Map
Nearby Homes