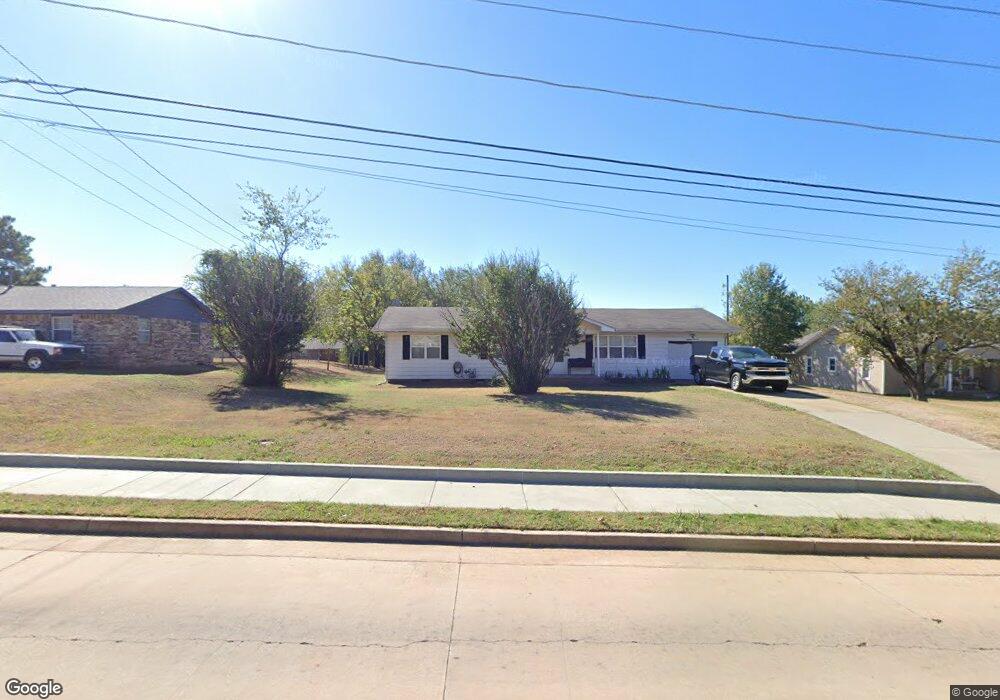
1813 E Main St Shawnee, OK 74801
Estimated Value: $86,000 - $140,000
3
Beds
1
Bath
1,320
Sq Ft
$83/Sq Ft
Est. Value
About This Home
This home is located at 1813 E Main St, Shawnee, OK 74801 and is currently estimated at $109,152, approximately $82 per square foot. 1813 E Main St is a home located in Pottawatomie County with nearby schools including Pleasant Grove Public School.
Ownership History
Date
Name
Owned For
Owner Type
Purchase Details
Closed on
Nov 15, 2019
Sold by
Simpson Ladonna
Bought by
Mee Phillip Randy and Mee Phillip R
Current Estimated Value
Home Financials for this Owner
Home Financials are based on the most recent Mortgage that was taken out on this home.
Original Mortgage
$81,094
Outstanding Balance
$70,885
Interest Rate
3.5%
Mortgage Type
FHA
Estimated Equity
$38,267
Purchase Details
Closed on
Feb 8, 2019
Sold by
Mee Phillip R
Bought by
Mee Phillip R and Simpson Ladonna
Purchase Details
Closed on
Nov 27, 2018
Sold by
Mee Phillip Randy and Brooks Shawna Mae
Bought by
Mee Phillip Randy
Home Financials for this Owner
Home Financials are based on the most recent Mortgage that was taken out on this home.
Original Mortgage
$69,190
Interest Rate
4.5%
Mortgage Type
FHA
Purchase Details
Closed on
May 13, 2004
Sold by
Yeubanks Clay and Yeubanks Stacie
Bought by
Mee Phillip and Mee Shawna
Purchase Details
Closed on
Aug 17, 2000
Sold by
Hasbel Carla Jo and Hasbel Lester
Bought by
Yeubanks Clay and Yeubanks Stacie
Create a Home Valuation Report for This Property
The Home Valuation Report is an in-depth analysis detailing your home's value as well as a comparison with similar homes in the area
Purchase History
| Date | Buyer | Sale Price | Title Company |
|---|---|---|---|
| Mee Phillip Randy | -- | First American Title | |
| Mee Phillip Randy | -- | First American Title | |
| Mee Phillip R | -- | None Available | |
| Mee Phillip Randy | -- | Title Source Inc | |
| Mee Phillip | $52,000 | -- | |
| Yeubanks Clay | $55,000 | -- |
Source: Public Records
Mortgage History
| Date | Status | Borrower | Loan Amount |
|---|---|---|---|
| Open | Mee Phillip Randy | $81,094 | |
| Previous Owner | Mee Phillip Randy | $69,190 |
Source: Public Records
Tax History
| Year | Tax Paid | Tax Assessment Tax Assessment Total Assessment is a certain percentage of the fair market value that is determined by local assessors to be the total taxable value of land and additions on the property. | Land | Improvement |
|---|---|---|---|---|
| 2025 | $414 | $6,458 | $474 | $5,984 |
| 2023 | $437 | $6,087 | $420 | $5,667 |
| 2022 | $441 | $6,087 | $420 | $5,667 |
| 2021 | $444 | $6,087 | $420 | $5,667 |
| 2020 | $447 | $6,087 | $420 | $5,667 |
| 2019 | $458 | $6,236 | $420 | $5,816 |
| 2018 | $409 | $6,203 | $420 | $5,783 |
| 2017 | $409 | $6,204 | $420 | $5,784 |
| 2016 | $395 | $6,024 | $420 | $5,604 |
| 2015 | $435 | $5,848 | $420 | $5,428 |
| 2014 | $497 | $6,540 | $420 | $6,120 |
Source: Public Records
Map
Nearby Homes
- 2305 E Main St
- 1416 E 9th St
- 301 Clubhouse Dr
- 1330 E Main St
- 321 S Lindale Ave
- 1313 E Whittaker St
- 1330 E Whittaker St
- 703 N Roosevelt Ave
- 1 Country Club Rd
- 322 S Draper Ave
- 1207 E 10th St
- 2310 Lakeside Cir
- 601 Pool Ln
- 1337 E Margaret St
- 648 N Cleveland Ave
- 209 S Ruth Ave
- 1119 E 11th St
- 1327 E Fay St
- 1322 E Margaret St
- 1314 E Margaret St
- 1920 E Main St
- 1809 E Main St
- 1812 E Main St
- 1806 E Main St
- 1903 E Main St
- 1907 E Main St
- 1905 E Main St
- 1805 E Main St
- 1902 E 7th Cir
- 1904 E 7th Cir
- 1909 E Main St
- 111 N Bryan Ave
- 1922 E Main St
- 1906 E 7th Cir
- 1908 E 7th Cir
- 1919 E Main St
- 1901 E 7th Cir
- 101 N Bryan Ave
- 1910 E 7th Cir
- 1903 E 7th Cir
Your Personal Tour Guide
Ask me questions while you tour the home.