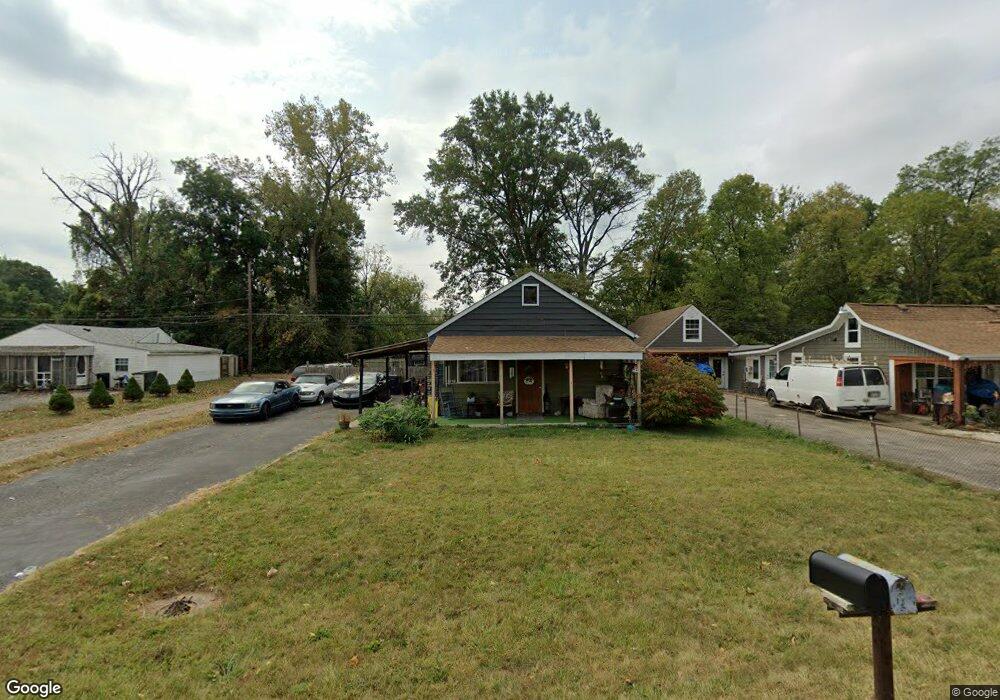
1813 Little Ave Columbus, OH 43223
Estimated Value: $150,000 - $191,000
3
Beds
1
Bath
1,032
Sq Ft
$161/Sq Ft
Est. Value
About This Home
This home is located at 1813 Little Ave, Columbus, OH 43223 and is currently estimated at $165,810, approximately $160 per square foot. 1813 Little Ave is a home located in Franklin County with nearby schools including Finland Elementary School, Franklin Woods Intermediate School, and Finland Middle School.
Ownership History
Date
Name
Owned For
Owner Type
Purchase Details
Closed on
Oct 31, 2024
Sold by
Barber Helen
Bought by
Griffith Daniel A and Griffith Mary
Current Estimated Value
Home Financials for this Owner
Home Financials are based on the most recent Mortgage that was taken out on this home.
Original Mortgage
$139,397
Outstanding Balance
$137,999
Interest Rate
6.08%
Mortgage Type
Credit Line Revolving
Estimated Equity
$27,811
Purchase Details
Closed on
Dec 18, 2023
Sold by
Smith Tyler
Bought by
Barber Helen
Purchase Details
Closed on
Feb 5, 2021
Sold by
Lowe Investings Llc
Bought by
Smith Tyler
Purchase Details
Closed on
Feb 3, 2021
Sold by
Reed Brent
Bought by
Lowe Investings Llc
Purchase Details
Closed on
Sep 15, 1965
Bought by
Keller Kenneth J
Create a Home Valuation Report for This Property
The Home Valuation Report is an in-depth analysis detailing your home's value as well as a comparison with similar homes in the area
Home Values in the Area
Average Home Value in this Area
Purchase History
| Date | Buyer | Sale Price | Title Company |
|---|---|---|---|
| Griffith Daniel A | $145,000 | Associates Title | |
| Griffith Daniel A | $145,000 | Associates Title | |
| Barber Helen | $120,600 | None Listed On Document | |
| Smith Tyler | $40,000 | None Available | |
| Lowe Investings Llc | $20,000 | None Available | |
| Keller Kenneth J | -- | -- |
Source: Public Records
Mortgage History
| Date | Status | Borrower | Loan Amount |
|---|---|---|---|
| Open | Griffith Daniel A | $139,397 | |
| Closed | Griffith Daniel A | $139,397 |
Source: Public Records
Tax History Compared to Growth
Tax History
| Year | Tax Paid | Tax Assessment Tax Assessment Total Assessment is a certain percentage of the fair market value that is determined by local assessors to be the total taxable value of land and additions on the property. | Land | Improvement |
|---|---|---|---|---|
| 2024 | $6,194 | $42,210 | $7,770 | $34,440 |
| 2023 | $2,369 | $42,210 | $7,770 | $34,440 |
| 2022 | $3,585 | $17,860 | $8,230 | $9,630 |
| 2021 | $1,449 | $17,860 | $8,230 | $9,630 |
| 2020 | $637 | $17,860 | $8,230 | $9,630 |
| 2019 | $435 | $14,320 | $6,860 | $7,460 |
| 2018 | $482 | $14,320 | $6,860 | $7,460 |
| 2017 | $501 | $14,320 | $6,860 | $7,460 |
| 2016 | $571 | $15,680 | $3,080 | $12,600 |
| 2015 | $530 | $15,680 | $3,080 | $12,600 |
| 2014 | $531 | $15,680 | $3,080 | $12,600 |
| 2013 | $364 | $18,410 | $3,605 | $14,805 |
Source: Public Records
Map
Nearby Homes
- 1757 Linnet Ave
- 1663 Hopkins Ave
- 1994 Little Ave
- 1723 Farberdale Dr
- 1417 Brown Rd
- 1390 Gray Meadow Dr
- 1659 Westmeadow Dr
- 1540 Little Ave
- 1417 Fahy Dr
- 1532 Westmeadow Dr
- 1743 Ransburg Ave
- 1617 Ransburg Ave
- 2210 October Ridge Dr
- 2180 Eakin Rd
- 1543 Red Leaf Ln
- 1607 Red Leaf Ln
- 2336 Woodbrook Cir N Unit 92 B
- 784-786 Butler Ave
- 1876 Vaughn St
- 2362 Woodbrook Cir N Unit 81
- 1823 Little Ave
- 1829 Little Ave
- 1803 Little Ave
- 1835 Little Ave
- 1795 Little Ave
- 1795 Little Ave Columbus
- 1814 Little Ave
- 1820 Little Ave
- 1843 Little Ave
- 1834 Little Ave
- 1785 Little Ave
- 1796 Little Ave
- 1849 Little Ave
- 1840 Little Ave
- 1792 Little Ave
- 1846 Little Ave
- 1863 Little Ave
- 1779 Little Ave
- 1803 Hopkins Ave
- 1811 Hopkins Ave