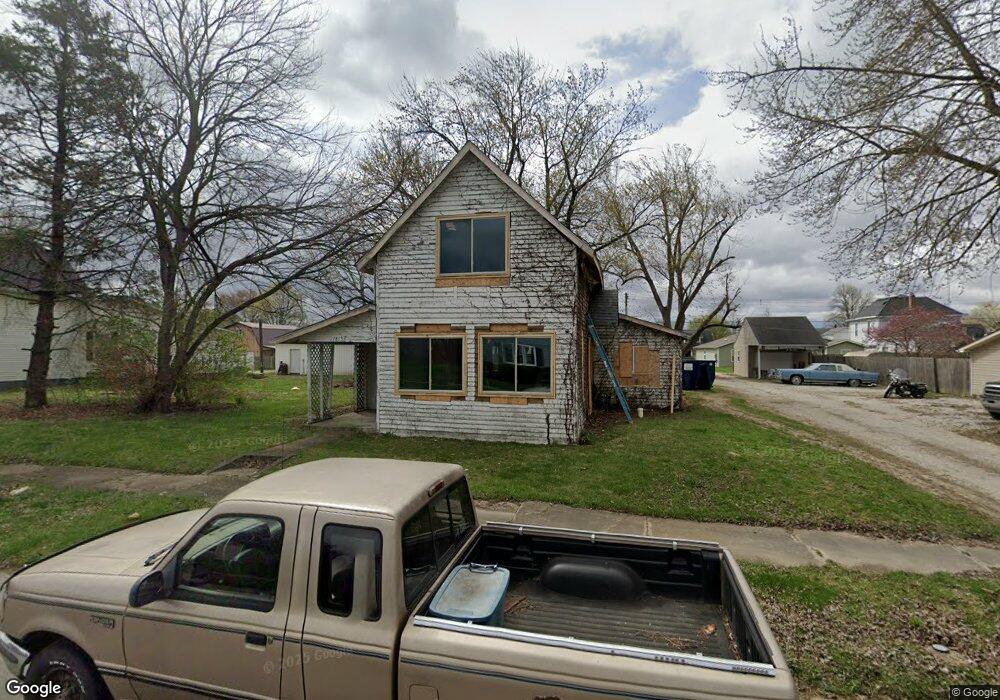
1813 N D St Elwood, IN 46036
Estimated Value: $86,858 - $154,000
4
Beds
1
Bath
1,568
Sq Ft
$85/Sq Ft
Est. Value
About This Home
This home is located at 1813 N D St, Elwood, IN 46036 and is currently estimated at $133,715, approximately $85 per square foot. 1813 N D St is a home located in Madison County with nearby schools including Elwood Elementary School, Elwood Intermediate School, and Elwood Junior-Senior High School.
Ownership History
Date
Name
Owned For
Owner Type
Purchase Details
Closed on
Dec 28, 2018
Sold by
Picket Fence Property Co
Bought by
Brown Jon
Current Estimated Value
Purchase Details
Closed on
Sep 11, 2018
Sold by
Madison County Auditor
Bought by
Picket Fence Property Co
Purchase Details
Closed on
Apr 9, 2018
Sold by
Rick County
Bought by
Picket Co
Purchase Details
Closed on
Jan 18, 2018
Sold by
David Rose
Bought by
Ramiro Fernandez
Purchase Details
Closed on
Dec 14, 2017
Sold by
Reo Logic Indiana Holdings Llc
Bought by
Rose David
Purchase Details
Closed on
Aug 5, 2015
Sold by
U S Bank
Bought by
Reo Logic Indiana Holdings Llc
Purchase Details
Closed on
May 7, 2015
Sold by
Madison County Auditor
Bought by
Us Bank
Create a Home Valuation Report for This Property
The Home Valuation Report is an in-depth analysis detailing your home's value as well as a comparison with similar homes in the area
Home Values in the Area
Average Home Value in this Area
Purchase History
| Date | Buyer | Sale Price | Title Company |
|---|---|---|---|
| Brown Jon | -- | None Available | |
| Picket Fence Property Co | $1,000 | None Available | |
| Picket Co | $1,000 | -- | |
| Ramiro Fernandez | $3,000 | -- | |
| Fernandez Ramiro | $3,000 | -- | |
| Rose David | -- | -- | |
| Reo Logic Indiana Holdings Llc | -- | -- | |
| Us Bank | $1,218 | -- |
Source: Public Records
Tax History Compared to Growth
Tax History
| Year | Tax Paid | Tax Assessment Tax Assessment Total Assessment is a certain percentage of the fair market value that is determined by local assessors to be the total taxable value of land and additions on the property. | Land | Improvement |
|---|---|---|---|---|
| 2025 | $280 | $14,000 | $11,100 | $2,900 |
| 2024 | $280 | $14,000 | $11,100 | $2,900 |
| 2023 | $264 | $13,200 | $10,600 | $2,600 |
| 2022 | $258 | $12,400 | $9,800 | $2,600 |
| 2021 | $238 | $11,900 | $9,600 | $2,300 |
| 2020 | $230 | $11,000 | $8,900 | $2,100 |
| 2019 | $230 | $11,000 | $8,900 | $2,100 |
| 2018 | $665 | $18,600 | $8,900 | $9,700 |
| 2017 | $478 | $23,900 | $8,900 | $15,000 |
| 2016 | $1,370 | $24,400 | $8,700 | $15,700 |
| 2014 | $494 | $24,700 | $8,900 | $15,800 |
| 2013 | $494 | $24,700 | $8,900 | $15,800 |
Source: Public Records
Map
Nearby Homes