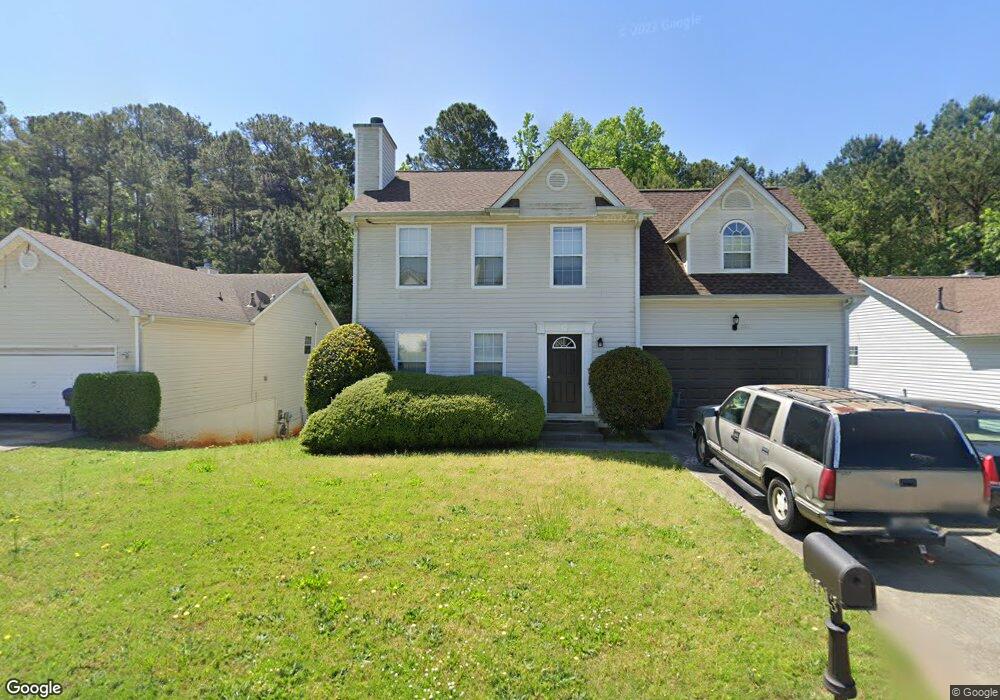
1813 Portwest Way Hampton, GA 30228
Estimated Value: $233,000 - $253,000
4
Beds
3
Baths
1,698
Sq Ft
$143/Sq Ft
Est. Value
About This Home
This home is located at 1813 Portwest Way, Hampton, GA 30228 and is currently estimated at $243,131, approximately $143 per square foot. 1813 Portwest Way is a home located in Clayton County with nearby schools including Kemp Primary School, Kemp Elementary School, and Lovejoy Middle School.
Ownership History
Date
Name
Owned For
Owner Type
Purchase Details
Closed on
Sep 10, 2010
Sold by
Hud-Housing Of Urban Dev
Bought by
Rowser Christopher L
Current Estimated Value
Home Financials for this Owner
Home Financials are based on the most recent Mortgage that was taken out on this home.
Original Mortgage
$55,112
Outstanding Balance
$36,535
Interest Rate
4.75%
Mortgage Type
FHA
Estimated Equity
$206,596
Purchase Details
Closed on
Jan 5, 2010
Sold by
Commonwealth United Mtg
Bought by
Hud-Housing Of Urban Dev
Purchase Details
Closed on
Dec 15, 2007
Sold by
Caliber Properties Llc
Bought by
Smith Eric and Smith Alaina M
Purchase Details
Closed on
Nov 22, 2002
Sold by
Smith Eric and Smith Alaina M
Bought by
Calibert Prop Llc
Purchase Details
Closed on
Jun 4, 1999
Sold by
Peachtree Homes Inc
Bought by
Smith Eric
Home Financials for this Owner
Home Financials are based on the most recent Mortgage that was taken out on this home.
Original Mortgage
$121,219
Interest Rate
7.04%
Mortgage Type
FHA
Create a Home Valuation Report for This Property
The Home Valuation Report is an in-depth analysis detailing your home's value as well as a comparison with similar homes in the area
Home Values in the Area
Average Home Value in this Area
Purchase History
| Date | Buyer | Sale Price | Title Company |
|---|---|---|---|
| Rowser Christopher L | -- | -- | |
| Hud-Housing Of Urban Dev | -- | -- | |
| Commonwealth United Mtg | $113,094 | -- | |
| Smith Eric | -- | -- | |
| Calibert Prop Llc | -- | -- | |
| Smith Eric | $122,900 | -- |
Source: Public Records
Mortgage History
| Date | Status | Borrower | Loan Amount |
|---|---|---|---|
| Open | Rowser Christopher L | $55,112 | |
| Previous Owner | Smith Eric | $121,219 |
Source: Public Records
Tax History Compared to Growth
Tax History
| Year | Tax Paid | Tax Assessment Tax Assessment Total Assessment is a certain percentage of the fair market value that is determined by local assessors to be the total taxable value of land and additions on the property. | Land | Improvement |
|---|---|---|---|---|
| 2024 | $3,577 | $100,800 | $7,200 | $93,600 |
| 2023 | $3,382 | $93,680 | $7,200 | $86,480 |
| 2022 | $2,338 | $68,680 | $7,200 | $61,480 |
| 2021 | $1,885 | $56,840 | $7,200 | $49,640 |
| 2020 | $1,834 | $54,982 | $7,200 | $47,782 |
| 2019 | $1,515 | $46,467 | $6,800 | $39,667 |
| 2018 | $1,334 | $41,986 | $6,800 | $35,186 |
| 2017 | $1,076 | $35,575 | $6,800 | $28,775 |
| 2016 | $1,127 | $36,826 | $6,800 | $30,026 |
| 2015 | $951 | $0 | $0 | $0 |
| 2014 | $705 | $26,827 | $6,800 | $20,027 |
Source: Public Records
Map
Nearby Homes
- 1741 Portwest Way
- 1683 Spoonbill Rd
- 10959 Thrasher Rd
- 1685 Kinglet Rd
- 1739 Cardinal Rd
- 11005 Regents Ct
- 10996 Shannon Cir
- 11057 Aliyah Dr
- 11045 Knotty Pine Place
- 1579 Leonard St
- 1558 Leonard St
- 10664 Sandpiper Rd
- 11059 Sedalia Way
- 11187 Shannon Cir
- 11179 Knotty Pine Place Unit I
- 11224 Aliyah Dr
- 1432 Shadow Creek Ave
- 1646 Flicker Rd
- 1590 Flicker Rd
- 10897 Paladin Dr
- 1807 Portwest Way
- 1819 Portwest Way
- 1801 Portwest Way
- 1801 Portwest Way Unit 10
- 1825 Portwest Way
- 1848 Portwest Way
- 1795 Portwest Way
- 1806 Portwest Way
- 1856 Portwest Way
- 1798 Portwest Way
- 1789 Portwest Way
- 1829 Portwest Way Unit 5
- 1829 Portwest Way
- 1839 Portwest Way
- 1833 Portwest Way
- 1864 Portwest Way
- 1783 Portwest Way
- 1851 Portwest Way
- 1786 Portwest Way
- 1900 Portwest Way