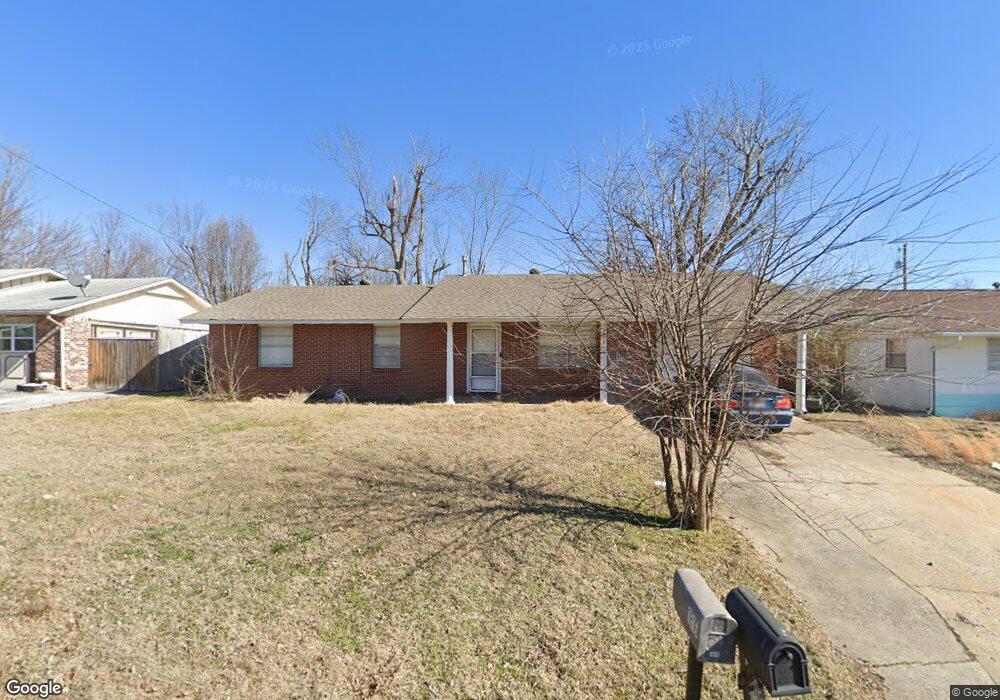
1813 S Craig Cir Rogers, AR 72758
Estimated Value: $246,904
3
Beds
2
Baths
1,176
Sq Ft
$210/Sq Ft
Est. Value
About This Home
This home is located at 1813 S Craig Cir, Rogers, AR 72758 and is currently priced at $246,904, approximately $209 per square foot. 1813 S Craig Cir is a home located in Benton County with nearby schools including Westside Elementary School, Oakdale Middle School, and Rogers Heritage High School.
Ownership History
Date
Name
Owned For
Owner Type
Purchase Details
Closed on
Mar 11, 2010
Sold by
Peak Susan K
Bought by
Peak Susan K and Susan K Peak Revocable Trust
Current Estimated Value
Purchase Details
Closed on
Oct 4, 2006
Sold by
Glenn Doris Jean
Bought by
Peak Susan Kaye
Purchase Details
Closed on
Feb 14, 2006
Sold by
Peak Susan Kaye
Bought by
Glenn Doris Jean
Purchase Details
Closed on
Jan 27, 2006
Sold by
Peak Michael Cleveland
Bought by
Peak Susan Kaye
Purchase Details
Closed on
Sep 30, 2004
Bought by
Peak
Purchase Details
Closed on
Sep 28, 2004
Bought by
Peak
Purchase Details
Closed on
Jun 28, 2004
Bought by
Jeffcoat
Purchase Details
Closed on
Jun 25, 2004
Bought by
Jeffcoat
Purchase Details
Closed on
Oct 24, 1986
Bought by
Anderson
Purchase Details
Closed on
Sep 22, 1973
Bought by
Phillips
Create a Home Valuation Report for This Property
The Home Valuation Report is an in-depth analysis detailing your home's value as well as a comparison with similar homes in the area
Home Values in the Area
Average Home Value in this Area
Purchase History
| Date | Buyer | Sale Price | Title Company |
|---|---|---|---|
| Peak Susan K | -- | None Available | |
| Peak Susan Kaye | -- | None Available | |
| Glenn Doris Jean | -- | None Available | |
| Peak Susan Kaye | -- | None Available | |
| Peak | $82,000 | -- | |
| Peak | $82,000 | -- | |
| Jeffcoat | $68,000 | -- | |
| Jeffcoat | $68,000 | -- | |
| Anderson | $40,000 | -- | |
| Phillips | $17,000 | -- |
Source: Public Records
Tax History Compared to Growth
Tax History
| Year | Tax Paid | Tax Assessment Tax Assessment Total Assessment is a certain percentage of the fair market value that is determined by local assessors to be the total taxable value of land and additions on the property. | Land | Improvement |
|---|---|---|---|---|
| 2025 | $1,488 | $43,318 | $19,000 | $24,318 |
| 2024 | $1,331 | $43,318 | $19,000 | $24,318 |
| 2023 | $1,210 | $25,700 | $8,000 | $17,700 |
| 2022 | $1,161 | $25,700 | $8,000 | $17,700 |
| 2021 | $1,062 | $25,700 | $8,000 | $17,700 |
| 2020 | $966 | $17,590 | $2,400 | $15,190 |
| 2019 | $966 | $17,590 | $2,400 | $15,190 |
| 2018 | $966 | $17,590 | $2,400 | $15,190 |
| 2017 | $790 | $17,590 | $2,400 | $15,190 |
| 2016 | $790 | $17,590 | $2,400 | $15,190 |
| 2015 | $732 | $13,840 | $3,000 | $10,840 |
| 2014 | $732 | $13,840 | $3,000 | $10,840 |
Source: Public Records
Map
Nearby Homes
- 1704 S Dixieland Rd
- 1811 S 22nd St
- 1701 Beth Dr
- 1611 S Beth Dr
- 1607 W New Hope Rd
- 2100 W New Hope Rd Unit 902
- Lot 1 W New Hope Rd
- 2327 W Seminole Dr
- 1725 S 15th St
- 2333 W Seminole Dr
- 2331 W Seminole Dr
- 1602 S 23rd Place
- 1604 S 23rd St
- 1903 Countryside Ln
- 1905 W Countryside Ln
- 1501 Countryside Cir
- 1600 S 23rd Place
- 1902 S 16th St
- 1012 S 19th St
- 1325 W New Hope Rd
- 1813 Craig Cir
- 1815 Craig Cir
- 1811 Craig Cir
- 1815 S Craig Cir
- 1809 Craig Cir
- 1817 Craig Cir
- 1816 Craig Cir
- 1818 Craig Cir
- 1814 Craig Cir
- 1819 Craig Cir
- 1807 Craig Cir
- 1820 Craig Cir
- 1812 Craig Cir
- 1812 W Lela St
- 1822 Craig Cir
- 1822 S Craig Cir
- 1810 Craig Cir
- 1821 Craig Cir
- 1805 S Craig Cir
- 1815 Beth Dr