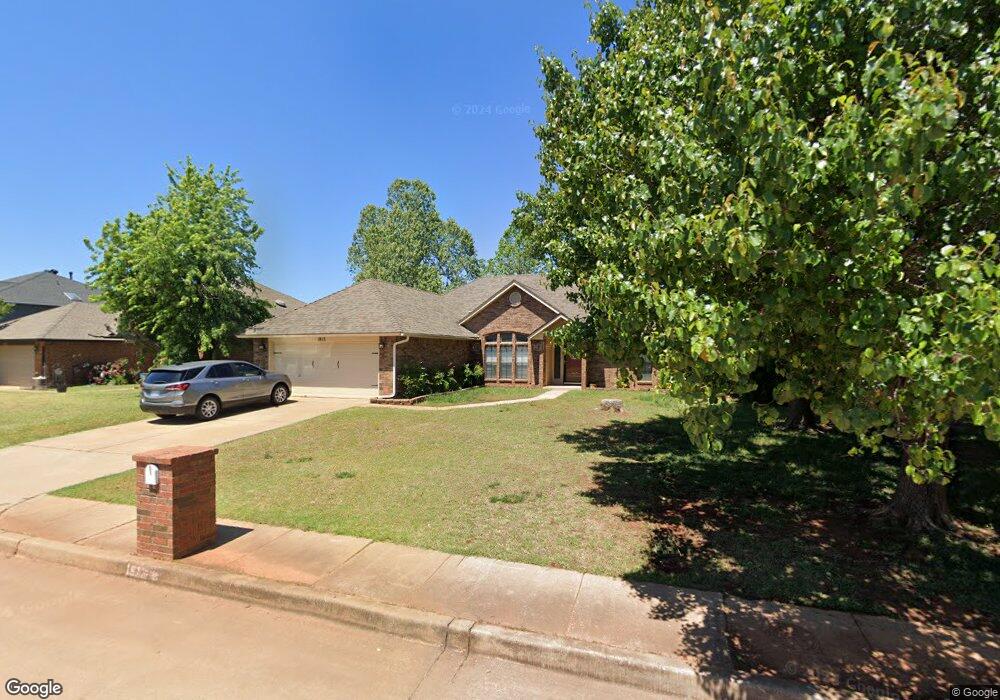
1813 Zion Place Edmond, OK 73003
Homestead-Edmond NeighborhoodEstimated Value: $244,528 - $259,000
3
Beds
2
Baths
1,654
Sq Ft
$152/Sq Ft
Est. Value
About This Home
This home is located at 1813 Zion Place, Edmond, OK 73003 and is currently estimated at $252,132, approximately $152 per square foot. 1813 Zion Place is a home located in Oklahoma County with nearby schools including Ida Freeman Elementary School, Cheyenne Middle School, and North High School.
Ownership History
Date
Name
Owned For
Owner Type
Purchase Details
Closed on
Oct 12, 2007
Sold by
Mannschreck Mike and Mannschreck Kristin
Bought by
Vadnais Moni E
Current Estimated Value
Home Financials for this Owner
Home Financials are based on the most recent Mortgage that was taken out on this home.
Original Mortgage
$141,000
Outstanding Balance
$88,529
Interest Rate
6.32%
Mortgage Type
Purchase Money Mortgage
Estimated Equity
$163,603
Purchase Details
Closed on
Apr 7, 2006
Sold by
Vadnais Moni E and Vadnais Andrea
Bought by
Mannschreck Mike and Mannschreck Kristin
Home Financials for this Owner
Home Financials are based on the most recent Mortgage that was taken out on this home.
Original Mortgage
$103,200
Interest Rate
6.32%
Mortgage Type
Fannie Mae Freddie Mac
Purchase Details
Closed on
Jul 1, 2003
Sold by
Boyd William R and Boyd Margaret E
Bought by
Vadnais Moni E
Purchase Details
Closed on
Jun 30, 2003
Sold by
Irions Patricia
Bought by
Boyd William R and Boyd Margaret E
Create a Home Valuation Report for This Property
The Home Valuation Report is an in-depth analysis detailing your home's value as well as a comparison with similar homes in the area
Home Values in the Area
Average Home Value in this Area
Purchase History
| Date | Buyer | Sale Price | Title Company |
|---|---|---|---|
| Vadnais Moni E | $141,000 | Stewart Abstract & Title Of | |
| Mannschreck Mike | $129,000 | Stewart Abstract & Title Of | |
| Vadnais Moni E | $93,000 | First American Title & Tr Co | |
| Boyd William R | -- | First American Title & Tr Co |
Source: Public Records
Mortgage History
| Date | Status | Borrower | Loan Amount |
|---|---|---|---|
| Open | Vadnais Moni E | $141,000 | |
| Previous Owner | Mannschreck Mike | $103,200 |
Source: Public Records
Tax History Compared to Growth
Tax History
| Year | Tax Paid | Tax Assessment Tax Assessment Total Assessment is a certain percentage of the fair market value that is determined by local assessors to be the total taxable value of land and additions on the property. | Land | Improvement |
|---|---|---|---|---|
| 2024 | $2,210 | $22,261 | $3,029 | $19,232 |
| 2023 | $2,210 | $21,201 | $2,974 | $18,227 |
| 2022 | $2,113 | $20,191 | $3,303 | $16,888 |
| 2021 | $2,003 | $19,230 | $3,474 | $15,756 |
| 2020 | $1,931 | $18,315 | $3,603 | $14,712 |
| 2019 | $1,853 | $17,498 | $3,582 | $13,916 |
| 2018 | $1,776 | $16,665 | $0 | $0 |
| 2017 | $1,791 | $16,884 | $3,603 | $13,281 |
| 2016 | $1,752 | $16,554 | $3,088 | $13,466 |
| 2015 | $1,726 | $16,332 | $3,088 | $13,244 |
| 2014 | $1,664 | $15,766 | $3,088 | $12,678 |
Source: Public Records
Map
Nearby Homes
- 1717 Rocky Mountain Way
- 613 Blue Ridge Dr
- 900 Blue Ridge Dr
- 1716 Glacier Ln
- 1717 Park View Place
- 733 Lapwing Rd
- 1725 Shady Ct
- 728 Teal Place
- 805 Mallard Ave
- 781 N Santa fe Ave
- 2321 Santa fe Cir
- 1712 Victoria Dr
- 1113 Swan Lake Rd
- 1101 Teal Place
- 1308 Isabella Dr
- 84 Kimberly Dr
- 232 Dooley Creek Ln
- 900 Woodhollow Trail
- 105 N Rockypoint Dr
- 2517 Antelope Cir
- 1809 Zion Place
- 1817 Zion Place
- 1816 Yosemite Place
- 1805 Zion Place
- 1812 Yosemite Place
- 1820 Yosemite Place
- 1808 Yosemite Place
- 1801 Zion Place
- 1808 Zion Place
- 1812 Zion Place
- 1804 Zion Place
- 1804 Yosemite Place
- 1816 Zion Place
- 1800 Zion Place
- 1721 Zion Place
- 1820 Zion Place
- 1800 Yosemite Place
- 1720 Zion Place
- 1817 Yosemite Place
- 1821 Yosemite Place