18130 Narrow Path Trail Doswell, VA 23047
Estimated Value: $345,000 - $544,000
3
Beds
4
Baths
2,354
Sq Ft
$200/Sq Ft
Est. Value
About This Home
This home is located at 18130 Narrow Path Trail, Doswell, VA 23047 and is currently estimated at $470,262, approximately $199 per square foot. 18130 Narrow Path Trail is a home located in Hanover County with nearby schools including Beaverdam Elementary School, Liberty Middle School, and Patrick Henry High School.
Ownership History
Date
Name
Owned For
Owner Type
Purchase Details
Closed on
May 30, 2017
Sold by
Mckinney Philip B and Mckinney Robin W
Bought by
Buchanan Brandon and Buchanan Whitney
Current Estimated Value
Home Financials for this Owner
Home Financials are based on the most recent Mortgage that was taken out on this home.
Original Mortgage
$212,121
Interest Rate
3.97%
Mortgage Type
New Conventional
Purchase Details
Closed on
Dec 22, 2016
Sold by
Mckinney Philip B and Mckinney Robin W
Bought by
Adams Christopher M and Adams Tracie H
Create a Home Valuation Report for This Property
The Home Valuation Report is an in-depth analysis detailing your home's value as well as a comparison with similar homes in the area
Home Values in the Area
Average Home Value in this Area
Purchase History
| Date | Buyer | Sale Price | Title Company |
|---|---|---|---|
| Buchanan Brandon | $210,000 | Attorney | |
| Adams Christopher M | -- | None Available |
Source: Public Records
Mortgage History
| Date | Status | Borrower | Loan Amount |
|---|---|---|---|
| Previous Owner | Buchanan Brandon | $212,121 |
Source: Public Records
Tax History
| Year | Tax Paid | Tax Assessment Tax Assessment Total Assessment is a certain percentage of the fair market value that is determined by local assessors to be the total taxable value of land and additions on the property. | Land | Improvement |
|---|---|---|---|---|
| 2025 | $3,110 | $383,900 | $69,900 | $314,000 |
| 2024 | $3,110 | $383,900 | $69,900 | $314,000 |
| 2023 | $2,907 | $377,600 | $67,600 | $310,000 |
| 2022 | $2,691 | $332,200 | $55,500 | $276,700 |
| 2021 | $2,358 | $291,100 | $46,400 | $244,700 |
| 2020 | $2,358 | $291,100 | $46,400 | $244,700 |
| 2019 | $2,042 | $291,100 | $46,400 | $244,700 |
| 2018 | $2,042 | $252,100 | $43,800 | $208,300 |
| 2017 | $407 | $50,300 | $50,300 | $0 |
| 2016 | $396 | $48,900 | $48,900 | $0 |
| 2015 | $396 | $48,900 | $48,900 | $0 |
| 2014 | $396 | $48,900 | $48,900 | $0 |
Source: Public Records
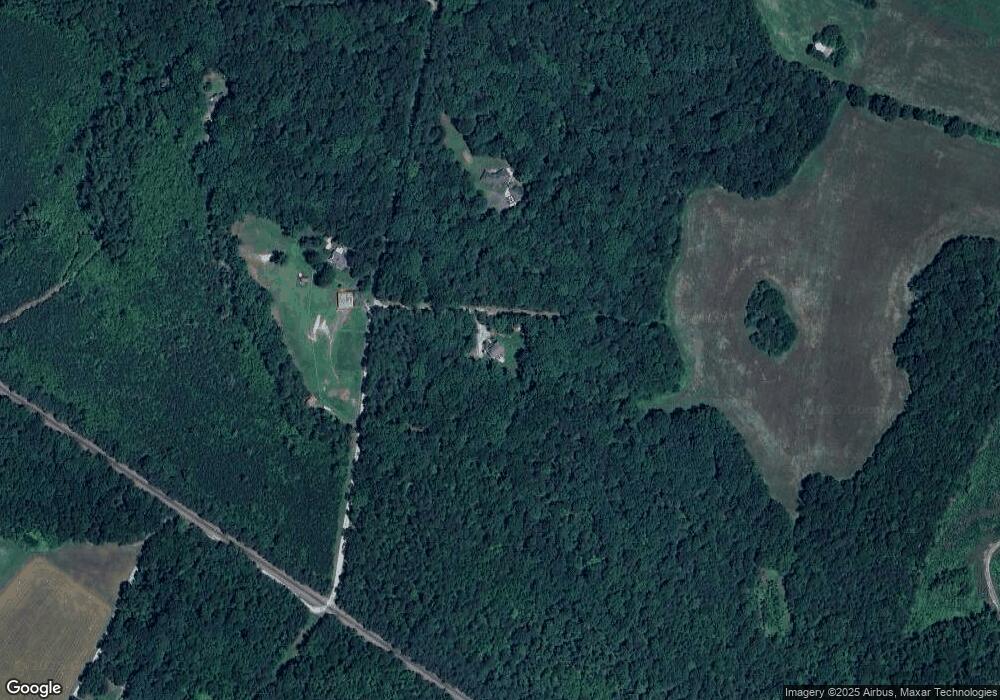
Map
Nearby Homes
- 0 Narrow Path Trail
- 13003 Sweet Gum St
- 18525 Noel Station Ln
- 26022 Zion Rd
- 0 US Route 1
- 16361 Little River Dr
- 17192 Katy Ln
- 7140 State Way
- 7135 State Way
- 24459 Us Route 1 Hwy
- 23206 Telegraph Rd
- 17471 Hewlett Rd
- 0000 Telegraph Rd
- Lot 1 Verdon Rd
- 24004 Ruther Glen Rd
- 49.26 Acres Jericho Rd
- 24378 Ruther Glen Rd
- 26405 Slash Pine Cir
- 26471 Slash Pine Cir
- 26571 Slash Pine Cir
- 18133 Narrow Path Trail
- 18140 Narrow Path Trail
- 18001 Narrow Path Trail
- 18145 Narrow Path Trail
- 12536 Verdon Rd
- 12582 Verdon Rd
- 12514 Verdon Rd
- 12522 Verdon Rd
- 12570 Verdon Rd
- 12572 Verdon Rd
- 12612 Verdon Rd
- 12592 Verdon Rd
- 12607 Verdon Rd
- 12425 Noel Rd
- 18029 Level Dr
- 18009 Level Dr
- 12651 Verdon Rd
- 12623 Verdon Rd
- 17657 Level Dr
- 12391 Verdon Rd
Your Personal Tour Guide
Ask me questions while you tour the home.