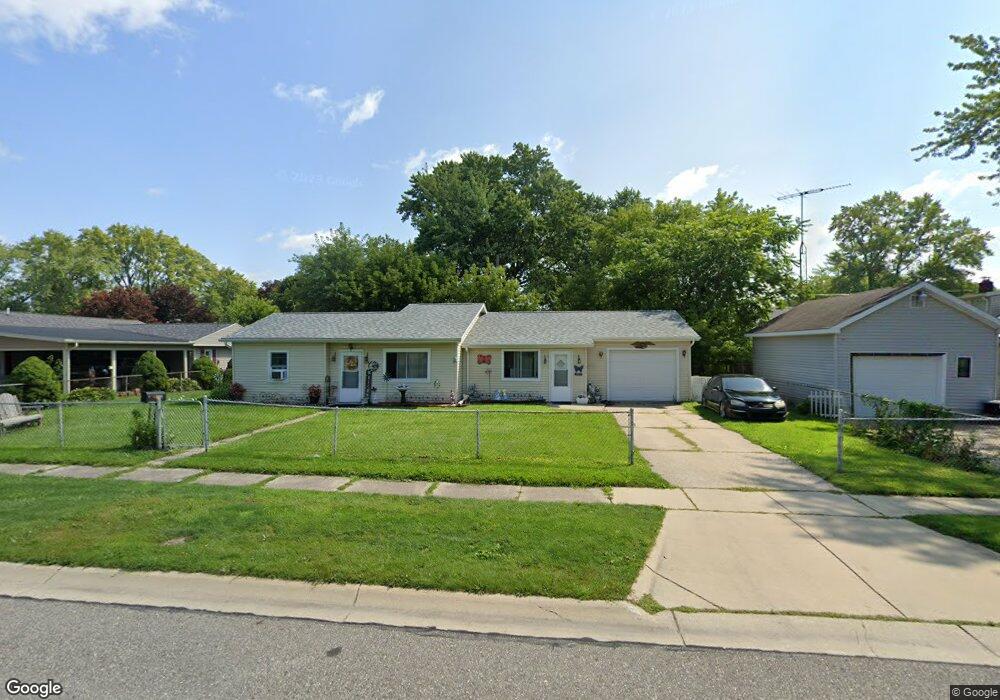
1814 21st St Port Huron, MI 48060
Estimated Value: $119,000 - $128,000
3
Beds
1
Bath
1,249
Sq Ft
$100/Sq Ft
Est. Value
About This Home
This home is located at 1814 21st St, Port Huron, MI 48060 and is currently estimated at $124,412, approximately $99 per square foot. 1814 21st St is a home located in St. Clair County with nearby schools including Michigamme Elementary School, Central Middle School, and Port Huron High School.
Ownership History
Date
Name
Owned For
Owner Type
Purchase Details
Closed on
Jul 18, 2011
Sold by
First National Bank Of America
Bought by
Stembridge Tammy M and Stembridge Robert F
Current Estimated Value
Purchase Details
Closed on
Jul 1, 2011
Sold by
Rose Acceptance Inc
Bought by
First National Bank Of America
Purchase Details
Closed on
Aug 18, 2010
Sold by
First National Acceptance Company
Bought by
Rose Acceptance Inc
Purchase Details
Closed on
Jul 28, 2008
Sold by
Griffin Daniel S and Griffin Michelle M
Bought by
First National Acceptance Company
Purchase Details
Closed on
Mar 5, 2007
Sold by
Griffin Daniel S and Griffin Michelle M
Bought by
Sanders Jerome and Brown Sanders Tammy L
Purchase Details
Closed on
May 27, 2005
Sold by
Brown Jack and Brown Mary B
Bought by
Griffin Dennis S and Griffin Michelle
Create a Home Valuation Report for This Property
The Home Valuation Report is an in-depth analysis detailing your home's value as well as a comparison with similar homes in the area
Home Values in the Area
Average Home Value in this Area
Purchase History
| Date | Buyer | Sale Price | Title Company |
|---|---|---|---|
| Stembridge Tammy M | -- | None Available | |
| First National Bank Of America | -- | None Available | |
| Rose Acceptance Inc | -- | None Available | |
| First National Acceptance Company | -- | None Available | |
| Sanders Jerome | -- | None Available | |
| Griffin Dennis S | $40,000 | None Available |
Source: Public Records
Tax History Compared to Growth
Tax History
| Year | Tax Paid | Tax Assessment Tax Assessment Total Assessment is a certain percentage of the fair market value that is determined by local assessors to be the total taxable value of land and additions on the property. | Land | Improvement |
|---|---|---|---|---|
| 2025 | $1,229 | $50,600 | $0 | $0 |
| 2024 | $990 | $47,900 | $0 | $0 |
| 2023 | $935 | $42,400 | $0 | $0 |
| 2022 | $917 | $35,000 | $0 | $0 |
| 2021 | $871 | $30,500 | $0 | $0 |
| 2020 | $881 | $26,800 | $26,800 | $0 |
| 2019 | $865 | $19,000 | $0 | $0 |
| 2018 | $847 | $19,000 | $0 | $0 |
| 2017 | $757 | $17,800 | $0 | $0 |
| 2016 | $636 | $17,800 | $0 | $0 |
| 2015 | $660 | $17,700 | $17,700 | $0 |
| 2014 | $660 | $18,400 | $18,400 | $0 |
| 2013 | -- | $19,400 | $0 | $0 |
Source: Public Records
Map
Nearby Homes