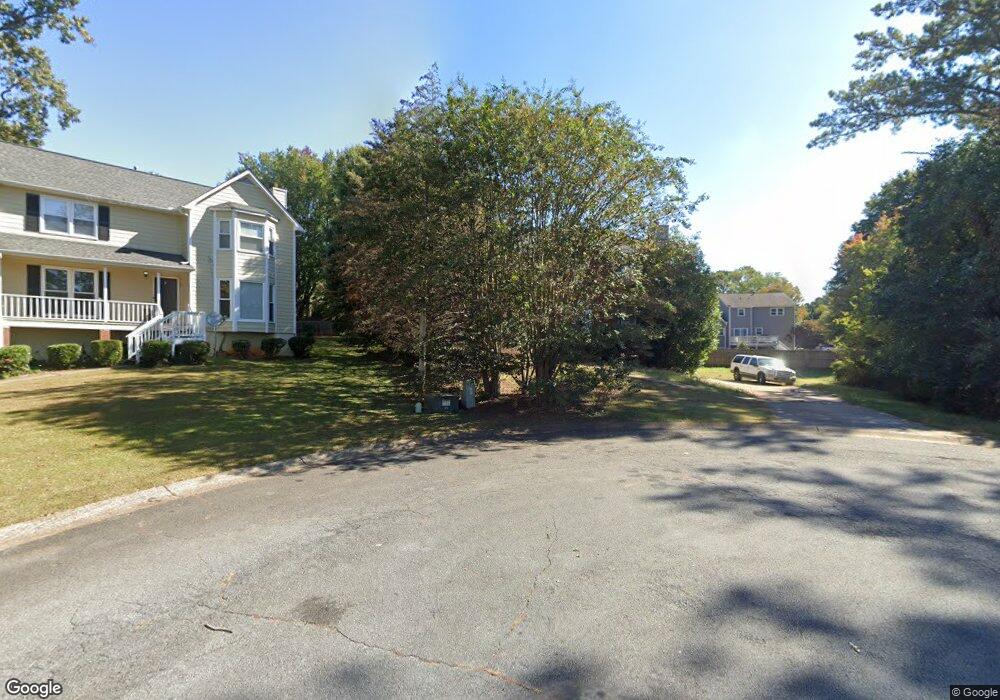
1814 Condor Ct Marietta, GA 30066
Sandy Plains NeighborhoodEstimated Value: $357,846 - $416,000
3
Beds
2
Baths
1,708
Sq Ft
$226/Sq Ft
Est. Value
About This Home
This charming 3-bedroom, 2-bathroom home is nestled in the desirable East Cobb neighborhood, renowned for its outstanding school districts. Tucked away in a peaceful cul-de-sac, this property offers a safe haven for children to play while providing parents with the privacy and tranquility they seek. The spacious layout and inviting outdoor area to make it perfect for family gatherings and your little one's' activities, ensuring a wonderful living experience in a community that's both welcoming and convenient.
Ownership History
Date
Name
Owned For
Owner Type
Purchase Details
Closed on
Oct 17, 2007
Sold by
Bowling Michael and Bowling Jennifer
Bought by
Davis Angelia
Current Estimated Value
Home Financials for this Owner
Home Financials are based on the most recent Mortgage that was taken out on this home.
Original Mortgage
$184,527
Outstanding Balance
$113,338
Interest Rate
6.26%
Mortgage Type
New Conventional
Estimated Equity
$272,374
Purchase Details
Closed on
Oct 29, 2004
Sold by
Bowling Michael D
Bought by
Bowling Michael D and Bowling Jennifer
Home Financials for this Owner
Home Financials are based on the most recent Mortgage that was taken out on this home.
Original Mortgage
$162,000
Interest Rate
5.66%
Mortgage Type
New Conventional
Create a Home Valuation Report for This Property
The Home Valuation Report is an in-depth analysis detailing your home's value as well as a comparison with similar homes in the area
Home Values in the Area
Average Home Value in this Area
Purchase History
| Date | Buyer | Sale Price | Title Company |
|---|---|---|---|
| Davis Angelia | $186,000 | -- | |
| Bowling Michael D | -- | -- | |
| Bowling Michael D | $180,000 | -- |
Source: Public Records
Mortgage History
| Date | Status | Borrower | Loan Amount |
|---|---|---|---|
| Open | Davis Angelia | $184,527 | |
| Previous Owner | Bowling Michael D | $162,000 |
Source: Public Records
Property History
| Date | Event | Price | List to Sale | Price per Sq Ft |
|---|---|---|---|---|
| 03/06/2025 03/06/25 | Off Market | $2,250 | -- | -- |
| 02/10/2025 02/10/25 | Off Market | -- | -- | -- |
| 01/30/2025 01/30/25 | For Rent | $2,250 | -- | -- |
| 01/30/2025 01/30/25 | For Rent | -- | -- | -- |
Tax History
| Year | Tax Paid | Tax Assessment Tax Assessment Total Assessment is a certain percentage of the fair market value that is determined by local assessors to be the total taxable value of land and additions on the property. | Land | Improvement |
|---|---|---|---|---|
| 2025 | $4,122 | $136,792 | $30,000 | $106,792 |
| 2024 | $4,124 | $136,792 | $30,000 | $106,792 |
| 2023 | $4,124 | $136,792 | $30,000 | $106,792 |
| 2022 | $3,692 | $121,640 | $22,000 | $99,640 |
| 2021 | $2,767 | $91,172 | $22,000 | $69,172 |
| 2020 | $2,452 | $80,776 | $22,000 | $58,776 |
| 2019 | $2,452 | $80,776 | $22,000 | $58,776 |
| 2018 | $2,206 | $72,676 | $22,000 | $50,676 |
| 2017 | $1,899 | $66,068 | $20,000 | $46,068 |
| 2016 | $1,899 | $66,068 | $20,000 | $46,068 |
| 2015 | $1,851 | $62,844 | $20,000 | $42,844 |
| 2014 | $1,867 | $62,844 | $0 | $0 |
Source: Public Records
Map
Nearby Homes
- 1680 Pinefield Rd
- 194 W Oaks Place
- 1222 W Oaks Way Unit 2
- 4922 Falcon Wood Trace
- 1658 Pine Ridge Cir Unit 3
- 4887 Willow Creek Dr
- 4922 Willow Creek Dr
- 1771 Rockwater Rd
- 300 Aurora Ave
- 5088 Ravenwood Dr
- 1949 N Landing Way
- 436 W Oaks Trail
- 423 W Oaks Trail
- 4797 North Trail
- 152 Sierra Cir
- 226 Hames Rd Unit 340
- 226 Hames Rd Unit 235
- 4910 Tremont Dr NE
- 301 Beebalm St
- 1914 Brittania Cir
- 1815 Condor Ct
- 4937 Condor Place NE
- 4935 Condor Place NE
- 1809 Condor Dr NE
- 1815 Condor Dr NE
- 4939 Condor Place NE
- 4933 Condor Place NE
- 1811 Condor Ct
- 1817 Condor Dr NE
- 1858 Falcon Wood Dr NE
- 1856 Falcon Wood Dr NE
- 1854 Falcon Wood Dr NE
- 1860 Falcon Wood Dr NE
- 1852 Falcon Wood Dr NE
- 4934 Condor Place NE
- 4938 Condor Place NE
- 4931 Condor Place NE
- 4936 Condor Place NE
- 1806 Condor Dr NE
- 1850 Falcon Wood Dr NE
Your Personal Tour Guide
Ask me questions while you tour the home.