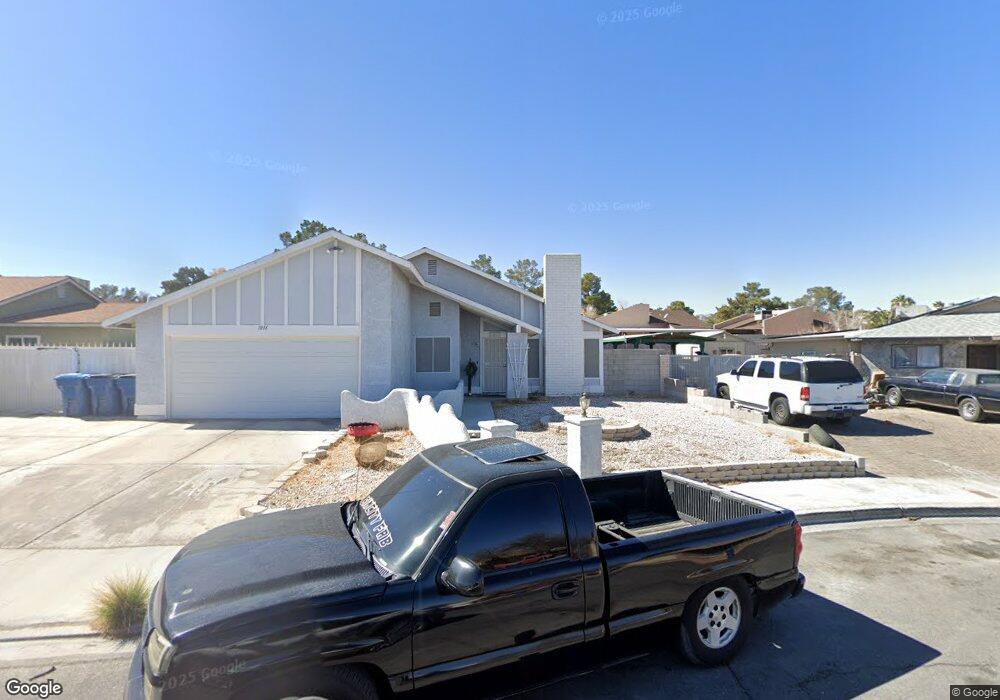
1814 Discus Dr Las Vegas, NV 89108
Michael Way NeighborhoodEstimated Value: $242,000 - $265,000
2
Beds
2
Baths
940
Sq Ft
$270/Sq Ft
Est. Value
About This Home
This home is located at 1814 Discus Dr, Las Vegas, NV 89108 and is currently estimated at $253,954, approximately $270 per square foot. 1814 Discus Dr is a home located in Clark County with nearby schools including Lilly & Wing Fong Elementary School, J. Harold Brinley Middle School, and Western High School.
Ownership History
Date
Name
Owned For
Owner Type
Purchase Details
Closed on
May 17, 2004
Sold by
Harrington Sandra Marie and Conyers Theresa Lynn
Bought by
Taylor Henry F
Current Estimated Value
Home Financials for this Owner
Home Financials are based on the most recent Mortgage that was taken out on this home.
Original Mortgage
$62,500
Outstanding Balance
$30,044
Interest Rate
5.86%
Mortgage Type
Commercial
Estimated Equity
$223,910
Purchase Details
Closed on
Nov 19, 1998
Sold by
Trierweiler Stefanie G
Bought by
Trierweiler Scott G
Home Financials for this Owner
Home Financials are based on the most recent Mortgage that was taken out on this home.
Original Mortgage
$64,000
Interest Rate
6.42%
Mortgage Type
Commercial
Purchase Details
Closed on
Nov 6, 1998
Sold by
Trierweiler Scott G
Bought by
Kratzert Barbara E
Home Financials for this Owner
Home Financials are based on the most recent Mortgage that was taken out on this home.
Original Mortgage
$64,000
Interest Rate
6.42%
Mortgage Type
Commercial
Create a Home Valuation Report for This Property
The Home Valuation Report is an in-depth analysis detailing your home's value as well as a comparison with similar homes in the area
Home Values in the Area
Average Home Value in this Area
Purchase History
| Date | Buyer | Sale Price | Title Company |
|---|---|---|---|
| Taylor Henry F | $125,000 | Fidelity National Title | |
| Trierweiler Scott G | -- | Stewart Title | |
| Kratzert Barbara E | $80,000 | Stewart Title |
Source: Public Records
Mortgage History
| Date | Status | Borrower | Loan Amount |
|---|---|---|---|
| Open | Taylor Henry F | $62,500 | |
| Previous Owner | Kratzert Barbara E | $64,000 |
Source: Public Records
Tax History Compared to Growth
Tax History
| Year | Tax Paid | Tax Assessment Tax Assessment Total Assessment is a certain percentage of the fair market value that is determined by local assessors to be the total taxable value of land and additions on the property. | Land | Improvement |
|---|---|---|---|---|
| 2025 | $974 | $37,329 | $15,050 | $22,279 |
| 2024 | $835 | $37,329 | $15,050 | $22,279 |
| 2023 | $835 | $39,475 | $17,850 | $21,625 |
| 2022 | $774 | $35,752 | $15,750 | $20,002 |
| 2021 | $717 | $31,460 | $12,250 | $19,210 |
| 2020 | $663 | $30,455 | $11,200 | $19,255 |
| 2019 | $621 | $28,298 | $9,100 | $19,198 |
| 2018 | $593 | $27,354 | $8,750 | $18,604 |
| 2017 | $863 | $25,962 | $7,350 | $18,612 |
| 2016 | $556 | $23,265 | $4,200 | $19,065 |
| 2015 | $554 | $19,268 | $3,500 | $15,768 |
| 2014 | $536 | $16,400 | $3,010 | $13,390 |
Source: Public Records
Map
Nearby Homes
- 1814 Marathon Dr
- 1801 Marathon Dr
- 1713 Amboy Dr
- 6633 Gazelle Dr
- 6520 Lombard Dr
- 1704 Kismet Cir
- 1701 Goodrich Cir
- 1630 Harvest Pecan Ct
- 1816 N Torrey Pines Dr
- 6400 Starcrest Dr
- 1516 Bonnie Castle Way
- 6637 Lund Dr
- 1624 N Torrey Pines Dr Unit 104
- 1608 N Torrey Pines Dr Unit 103
- 1624 N Torrey Pines Dr Unit 101
- 1436 Padre Bay Dr
- 1900 N Torrey Pines Dr Unit 212
- 1900 N Torrey Pines Dr Unit 223
- 1600 N Torrey Pines Dr Unit 202
- 1600 N Torrey Pines Dr Unit 101