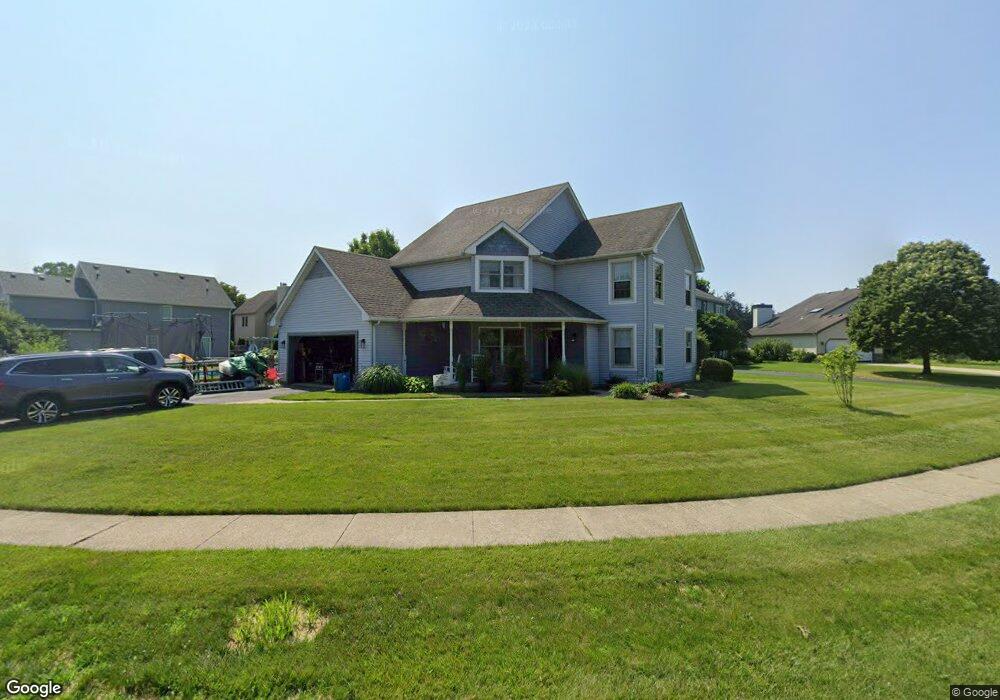
1814 Kettle Run Ct Perrysburg, OH 43551
Estimated Value: $376,755 - $396,000
3
Beds
3
Baths
2,257
Sq Ft
$171/Sq Ft
Est. Value
About This Home
This home is located at 1814 Kettle Run Ct, Perrysburg, OH 43551 and is currently estimated at $386,189, approximately $171 per square foot. 1814 Kettle Run Ct is a home located in Wood County with nearby schools including Fort Meigs Elementary School, Perrysburg Junior High School, and Perrysburg High School.
Ownership History
Date
Name
Owned For
Owner Type
Purchase Details
Closed on
Dec 27, 2007
Sold by
Jackson Howard L and Jackson Nancy L
Bought by
Templeton Ryan C and Templeton Angelica
Current Estimated Value
Home Financials for this Owner
Home Financials are based on the most recent Mortgage that was taken out on this home.
Original Mortgage
$193,000
Outstanding Balance
$122,522
Interest Rate
6.27%
Mortgage Type
Purchase Money Mortgage
Estimated Equity
$263,667
Purchase Details
Closed on
Sep 5, 2003
Sold by
Stump Raymond L and Stump Cynthia B
Bought by
Jackson Howard L and Jackson Nancy L
Home Financials for this Owner
Home Financials are based on the most recent Mortgage that was taken out on this home.
Original Mortgage
$147,920
Interest Rate
3.75%
Mortgage Type
Purchase Money Mortgage
Purchase Details
Closed on
Jul 22, 2002
Sold by
Stump Raymond L and Stump Cynthia B
Bought by
Stump Raymond L and Stump Cynthia B
Purchase Details
Closed on
Jul 9, 1993
Bought by
Hillier Steven H
Create a Home Valuation Report for This Property
The Home Valuation Report is an in-depth analysis detailing your home's value as well as a comparison with similar homes in the area
Home Values in the Area
Average Home Value in this Area
Purchase History
| Date | Buyer | Sale Price | Title Company |
|---|---|---|---|
| Templeton Ryan C | $193,000 | Multiple | |
| Jackson Howard L | $184,900 | Midland Title | |
| Stump Raymond L | -- | -- | |
| Hillier Steven H | -- | -- |
Source: Public Records
Mortgage History
| Date | Status | Borrower | Loan Amount |
|---|---|---|---|
| Open | Templeton Ryan C | $193,000 | |
| Previous Owner | Jackson Howard L | $147,920 |
Source: Public Records
Tax History Compared to Growth
Tax History
| Year | Tax Paid | Tax Assessment Tax Assessment Total Assessment is a certain percentage of the fair market value that is determined by local assessors to be the total taxable value of land and additions on the property. | Land | Improvement |
|---|---|---|---|---|
| 2024 | $6,089 | $105,245 | $16,030 | $89,215 |
| 2023 | $6,089 | $105,250 | $16,030 | $89,220 |
| 2021 | $5,439 | $86,520 | $14,000 | $72,520 |
| 2020 | $5,410 | $86,520 | $14,000 | $72,520 |
| 2019 | $4,763 | $73,920 | $14,000 | $59,920 |
| 2018 | $4,228 | $73,920 | $14,000 | $59,920 |
| 2017 | $3,997 | $73,920 | $14,000 | $59,920 |
| 2016 | $3,939 | $66,290 | $14,700 | $51,590 |
| 2015 | $3,939 | $66,290 | $14,700 | $51,590 |
| 2014 | $3,973 | $66,290 | $14,700 | $51,590 |
| 2013 | $3,871 | $63,140 | $14,000 | $49,140 |
Source: Public Records
Map
Nearby Homes
- 2053 Lexington Dr
- 2062 Lexington Dr
- 26802 Fort Meigs Rd
- 26835 Mohawk Dr
- 13975 Eckel Junction Rd
- 26951 Ottekee Dr
- 125 Ottekee Dr
- 664 Little Creek Dr
- 1626 Woodstream Rd
- 700 Delaware Dr
- 471 Rutledge Ct
- 454 S Ridge Dr
- 670 Ridge Lake Ct
- 142 Barton Creek Dr
- 144 Barton Creek Dr
- 140 Barton Creek Dr
- 158 Barton Creek Dr
- 168 Barton Creek Dr
- 162 Barton Creek Dr
- 169 Barton Creek Dr
- 1834 Kettle Run Ct
- 1792 Kettle Run Ct
- 1781 Lexington Dr
- 1842 Kettle Run Ct
- 1795 Kettle Run Ct
- 1823 Kettle Run Ct
- 1805 Kettle Run Ct
- 1793 Lexington Dr
- 1783 Kettle Run Ct
- 1813 Kettle Run Ct
- 1811 Lexington Dr
- 1848 Kettle Run Ct
- 1833 Kettle Run Ct
- 1771 Kettle Run Ct
- 1841 Kettle Run Ct
- 1847 Kettle Run Ct
- 1851 Kettle Run Ct
- 1759 Kettle Run Ct
- 1772 Lexington Dr
- 1843 Lexington Dr