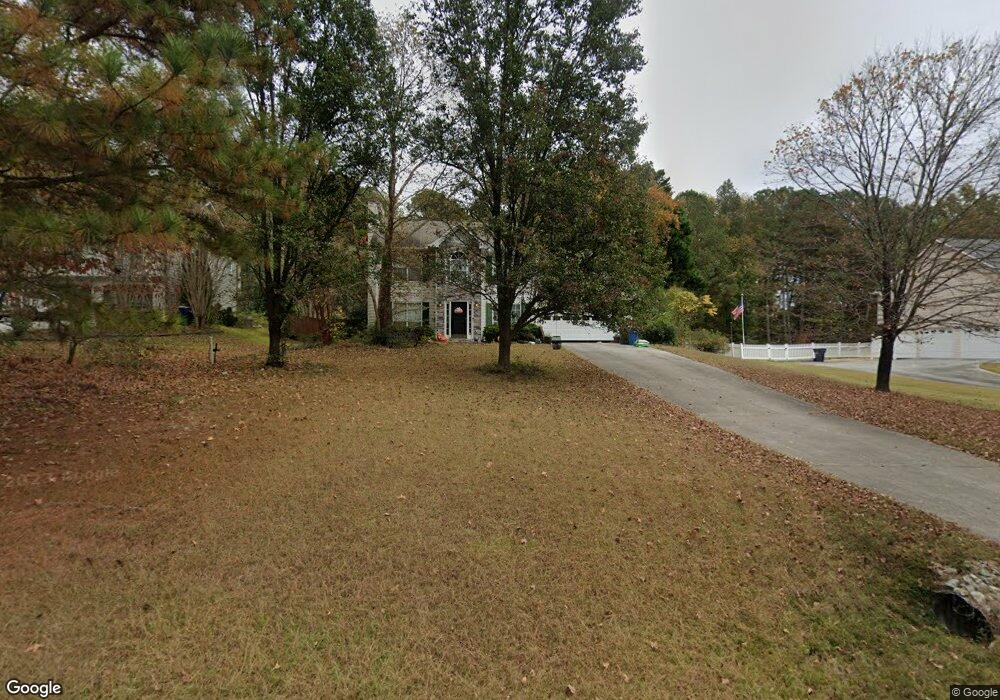
1814 Mcconnell Rd Grayson, GA 30017
Estimated Value: $315,000 - $378,000
3
Beds
3
Baths
2,038
Sq Ft
$175/Sq Ft
Est. Value
About This Home
This home is located at 1814 Mcconnell Rd, Grayson, GA 30017 and is currently estimated at $355,683, approximately $174 per square foot. 1814 Mcconnell Rd is a home located in Gwinnett County with nearby schools including Starling Elementary School, Couch Middle School, and Grayson High School.
Ownership History
Date
Name
Owned For
Owner Type
Purchase Details
Closed on
Jun 30, 2011
Sold by
Bank United Fsb
Bought by
Stepp Laura L
Current Estimated Value
Home Financials for this Owner
Home Financials are based on the most recent Mortgage that was taken out on this home.
Original Mortgage
$82,505
Outstanding Balance
$56,233
Interest Rate
4.62%
Mortgage Type
FHA
Estimated Equity
$299,450
Purchase Details
Closed on
Oct 5, 2010
Sold by
Mayes Russell E
Bought by
Bank United
Purchase Details
Closed on
Sep 28, 2004
Sold by
Moore James C and Moore Dana
Bought by
Mayes Russell E
Home Financials for this Owner
Home Financials are based on the most recent Mortgage that was taken out on this home.
Original Mortgage
$135,900
Interest Rate
4.87%
Mortgage Type
New Conventional
Purchase Details
Closed on
Jul 31, 1998
Sold by
Tuck Andrea N and Tuck Brian
Bought by
Moore James C and Moore Dana
Home Financials for this Owner
Home Financials are based on the most recent Mortgage that was taken out on this home.
Original Mortgage
$91,500
Interest Rate
6.91%
Mortgage Type
New Conventional
Purchase Details
Closed on
Jun 21, 1996
Sold by
Park Place Homes Inc
Bought by
Santimouro Adrea N Tuck Brian
Create a Home Valuation Report for This Property
The Home Valuation Report is an in-depth analysis detailing your home's value as well as a comparison with similar homes in the area
Home Values in the Area
Average Home Value in this Area
Purchase History
| Date | Buyer | Sale Price | Title Company |
|---|---|---|---|
| Stepp Laura L | $84,700 | -- | |
| Bank United | $125,000 | -- | |
| Mayes Russell E | $169,900 | -- | |
| Moore James C | $117,500 | -- | |
| Santimouro Adrea N Tuck Brian | $111,400 | -- |
Source: Public Records
Mortgage History
| Date | Status | Borrower | Loan Amount |
|---|---|---|---|
| Open | Stepp Laura L | $82,505 | |
| Previous Owner | Mayes Russell E | $135,900 | |
| Previous Owner | Moore James C | $91,500 | |
| Closed | Santimouro Adrea N Tuck Brian | $0 |
Source: Public Records
Tax History
| Year | Tax Paid | Tax Assessment Tax Assessment Total Assessment is a certain percentage of the fair market value that is determined by local assessors to be the total taxable value of land and additions on the property. | Land | Improvement |
|---|---|---|---|---|
| 2025 | $3,646 | $137,760 | $26,120 | $111,640 |
| 2024 | $3,878 | $143,160 | $26,120 | $117,040 |
| 2023 | $3,878 | $140,440 | $29,200 | $111,240 |
| 2022 | $3,190 | $111,680 | $24,400 | $87,280 |
| 2021 | $2,837 | $92,600 | $17,600 | $75,000 |
| 2020 | $2,641 | $82,600 | $17,600 | $65,000 |
| 2019 | $2,423 | $75,360 | $16,000 | $59,360 |
| 2018 | $2,322 | $70,760 | $14,400 | $56,360 |
| 2016 | $2,143 | $61,440 | $12,000 | $49,440 |
| 2015 | $1,994 | $53,840 | $12,000 | $41,840 |
| 2014 | $2,055 | $53,840 | $12,000 | $41,840 |
Source: Public Records
Map
Nearby Homes
- 1858 Mcconnell Rd
- 216 Brackin Trace
- 170 Clark Lake Ln
- 490 Brackin Trace
- 101 Whitegrass Way
- 120 Whitegrass Way
- 2091 Ecoland Dr
- 2101 Ecoland Dr
- 14 Green Love Ln
- 2151 Grayfield Dr
- 1611 Silvergrass Ln
- 2341 Herring Woods Trail
- 145 Millennial Ct
- 1755 Wheat Grass Way
- 495 Brackin Trace
- 1421 Sutters Dr
- 567 Barlow Place
- 532 Barlow Place
- 492 Glenns Farm Ln Unit 1
- 561 Glenns Farm Way
- 1804 Mcconnell Rd
- 1804 Mcconnell Rd Unit 11
- 41 Leighs Grove Way
- 1824 Mcconnell Rd
- 45 Leighs Grove Way Unit 10
- 45 Leighs Grove Way
- 45 Leighs Grove Way Unit 4
- 45 Leighs Grove Way
- 1822 Ivy Breeze Ct
- 0 Mcconnell Rd Unit 23 8062406
- Lot 23 Mcconnell Rd
- 1834 Mcconnell Rd Unit 3
- 51 Leighs Grove Way
- 1811 Ivy Breeze Ct Unit 1
- 1821 Mcconnell Rd
- 1812 Ivy Breeze Ct
- 55 Leighs Grove Way Unit 4
- 31 Leighs Grove Way
- 1838 Mcconnell Rd
- 0 Ivy Breeze Ct Unit 8063443
Your Personal Tour Guide
Ask me questions while you tour the home.