Estimated Value: $110,564 - $157,000
2
Beds
1
Bath
688
Sq Ft
$182/Sq Ft
Est. Value
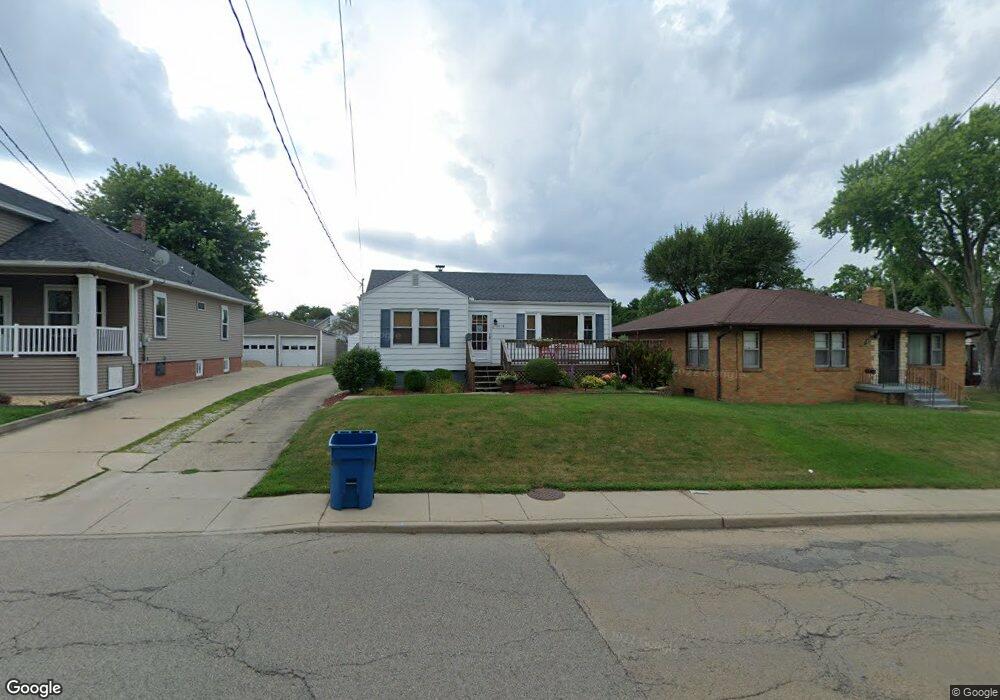
About This Home
This home is located at 1814 Pulaski St, Peru, IL 61354 and is currently estimated at $124,891, approximately $181 per square foot. 1814 Pulaski St is a home located in LaSalle County with nearby schools including Northview Elementary School, Parkside Middle School, and Trinity Catholic Academy.
Ownership History
Date
Name
Owned For
Owner Type
Purchase Details
Closed on
Jul 7, 2016
Sold by
Loving Camille and Holmbeck Jacob
Bought by
Padilla Amber L
Current Estimated Value
Home Financials for this Owner
Home Financials are based on the most recent Mortgage that was taken out on this home.
Original Mortgage
$82,450
Outstanding Balance
$65,650
Interest Rate
3.5%
Mortgage Type
New Conventional
Estimated Equity
$59,241
Purchase Details
Closed on
Oct 23, 2012
Sold by
Loving Camille
Bought by
Loving Camille and Holmbeck Jacob
Create a Home Valuation Report for This Property
The Home Valuation Report is an in-depth analysis detailing your home's value as well as a comparison with similar homes in the area
Home Values in the Area
Average Home Value in this Area
Purchase History
| Date | Buyer | Sale Price | Title Company |
|---|---|---|---|
| Padilla Amber L | $85,000 | -- | |
| Loving Camille | -- | None Available |
Source: Public Records
Mortgage History
| Date | Status | Borrower | Loan Amount |
|---|---|---|---|
| Open | Padilla Amber L | $82,450 |
Source: Public Records
Tax History
| Year | Tax Paid | Tax Assessment Tax Assessment Total Assessment is a certain percentage of the fair market value that is determined by local assessors to be the total taxable value of land and additions on the property. | Land | Improvement |
|---|---|---|---|---|
| 2024 | $1,724 | $28,114 | $4,125 | $23,989 |
| 2023 | $1,744 | $28,043 | $3,364 | $24,679 |
| 2022 | $1,598 | $26,065 | $3,127 | $22,938 |
| 2021 | $1,520 | $24,862 | $2,983 | $21,879 |
| 2020 | $1,459 | $24,251 | $2,910 | $21,341 |
| 2019 | $1,426 | $23,829 | $2,859 | $20,970 |
| 2018 | $1,376 | $23,201 | $2,784 | $20,417 |
| 2017 | $1,344 | $22,951 | $2,754 | $20,197 |
| 2016 | $1,292 | $22,194 | $2,663 | $19,531 |
| 2015 | $1,143 | $21,439 | $2,572 | $18,867 |
| 2012 | -- | $22,817 | $2,738 | $20,079 |
Source: Public Records
Map
Nearby Homes
Your Personal Tour Guide
Ask me questions while you tour the home.