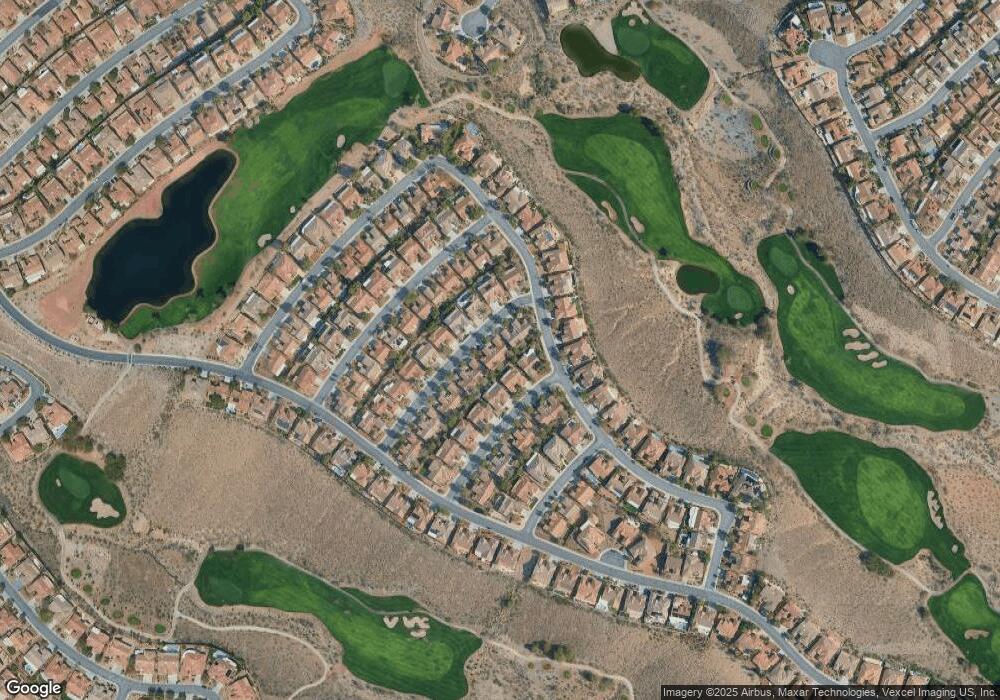
1814 Tarrant City St Henderson, NV 89052
Sun City Anthem NeighborhoodEstimated Value: $429,854 - $455,000
2
Beds
2
Baths
1,464
Sq Ft
$299/Sq Ft
Est. Value
About This Home
This home is located at 1814 Tarrant City St, Henderson, NV 89052 and is currently estimated at $437,714, approximately $298 per square foot. 1814 Tarrant City St is a home located in Clark County with nearby schools including Shirley & Bill Wallin Elementary School, Del E. Webb Middle School, and Liberty High School.
Ownership History
Date
Name
Owned For
Owner Type
Purchase Details
Closed on
Feb 22, 2017
Sold by
Lim Basilio Y and Lim Rosie C
Bought by
Lim Basilio Yu and Lim Rosie Chu
Current Estimated Value
Purchase Details
Closed on
Aug 1, 2000
Sold by
Del Webb Communities Inc
Bought by
Lim Basilio Y and Lim Rosie C
Home Financials for this Owner
Home Financials are based on the most recent Mortgage that was taken out on this home.
Original Mortgage
$129,650
Interest Rate
8.16%
Create a Home Valuation Report for This Property
The Home Valuation Report is an in-depth analysis detailing your home's value as well as a comparison with similar homes in the area
Home Values in the Area
Average Home Value in this Area
Purchase History
| Date | Buyer | Sale Price | Title Company |
|---|---|---|---|
| Lim Basilio Yu | -- | None Available | |
| Lim Basilio Y | $162,354 | Del Webb Title Company Nevad |
Source: Public Records
Mortgage History
| Date | Status | Borrower | Loan Amount |
|---|---|---|---|
| Closed | Lim Basilio Y | $129,650 |
Source: Public Records
Tax History Compared to Growth
Tax History
| Year | Tax Paid | Tax Assessment Tax Assessment Total Assessment is a certain percentage of the fair market value that is determined by local assessors to be the total taxable value of land and additions on the property. | Land | Improvement |
|---|---|---|---|---|
| 2025 | $1,942 | $99,243 | $38,150 | $61,093 |
| 2024 | $1,886 | $99,243 | $38,150 | $61,093 |
| 2023 | $1,886 | $87,396 | $31,500 | $55,896 |
| 2022 | $1,831 | $81,031 | $28,000 | $53,031 |
| 2021 | $1,778 | $69,578 | $26,250 | $43,328 |
| 2020 | $1,723 | $71,493 | $26,250 | $45,243 |
| 2019 | $1,673 | $67,795 | $22,750 | $45,045 |
| 2018 | $1,624 | $65,923 | $22,750 | $43,173 |
| 2017 | $1,859 | $63,205 | $21,000 | $42,205 |
| 2016 | $1,539 | $56,493 | $13,300 | $43,193 |
| 2015 | $1,535 | $54,278 | $11,900 | $42,378 |
| 2014 | $1,490 | $48,968 | $10,500 | $38,468 |
Source: Public Records
Map
Nearby Homes
- 1806 Tarrant City St
- 2831 Somerset Springs Dr
- 2962 Gettysburg Ave
- 1628 Rockcrest Hills Ave
- 1717 Warrington Dr
- 2936 Sumter Valley Cir
- 1691 Wellington Springs Ave
- 1605 Williamsport St
- 1661 Hartley Ave
- 2601 Harrisburg Ave
- 1805 Prichard Ave
- 2609 Rangely Ave
- 3000 Monroe Park Rd
- 1749 Warrington Dr
- 1383 Opal Valley St
- 1673 Ravanusa Dr
- 1700 Ravanusa Dr
- 1652 Black Fox Canyon Rd
- 2874 Hartwick Pines Dr
- 3017 Monroe Park Rd
- 1818 Tarrant City St
- 1810 Tarrant City St
- 1822 Tarrant City St
- 1825 Atlanta St
- 1821 Atlanta St
- 1826 Tarrant City St
- 1829 Atlanta St
- 1813 Tarrant City St
- 1817 Tarrant City St
- 1821 Tarrant City St
- 1809 Tarrant City St
- 1830 Tarrant City St
- 1837 Atlanta St
- 1829 Tarrant City St
- 2872 Forest Grove Dr
- 1805 Tarrant City St
- 2876 Forest Grove Dr
- 1834 Tarrant City St
- 2868 Forest Grove Dr
- 1822 Atlanta St
