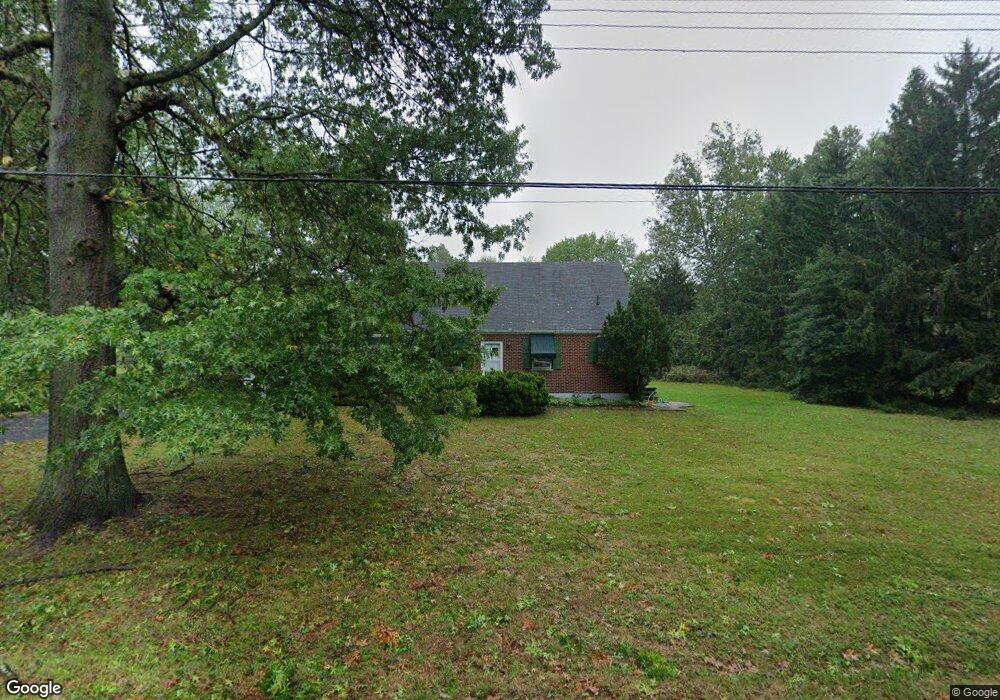
1814 Wanninger Ln Cincinnati, OH 45255
Estimated Value: $309,000 - $340,000
5
Beds
2
Baths
1,100
Sq Ft
$294/Sq Ft
Est. Value
About This Home
This home is located at 1814 Wanninger Ln, Cincinnati, OH 45255 and is currently estimated at $323,642, approximately $294 per square foot. 1814 Wanninger Ln is a home located in Hamilton County with nearby schools including Summit Elementary School, Nagel Middle School, and Anderson High School.
Ownership History
Date
Name
Owned For
Owner Type
Purchase Details
Closed on
Aug 24, 2004
Sold by
Tuchfarber Barbara J
Bought by
Sullivan Thomas L
Current Estimated Value
Home Financials for this Owner
Home Financials are based on the most recent Mortgage that was taken out on this home.
Original Mortgage
$96,400
Outstanding Balance
$48,121
Interest Rate
6.1%
Mortgage Type
Unknown
Estimated Equity
$275,521
Purchase Details
Closed on
Jun 18, 2004
Sold by
Estate Of Velma Marie Sullivan
Bought by
Sullivan William L
Create a Home Valuation Report for This Property
The Home Valuation Report is an in-depth analysis detailing your home's value as well as a comparison with similar homes in the area
Home Values in the Area
Average Home Value in this Area
Purchase History
| Date | Buyer | Sale Price | Title Company |
|---|---|---|---|
| Sullivan Thomas L | $144,000 | -- | |
| Sullivan William L | -- | -- |
Source: Public Records
Mortgage History
| Date | Status | Borrower | Loan Amount |
|---|---|---|---|
| Open | Sullivan Thomas L | $96,400 |
Source: Public Records
Tax History Compared to Growth
Tax History
| Year | Tax Paid | Tax Assessment Tax Assessment Total Assessment is a certain percentage of the fair market value that is determined by local assessors to be the total taxable value of land and additions on the property. | Land | Improvement |
|---|---|---|---|---|
| 2024 | $5,227 | $85,709 | $22,481 | $63,228 |
| 2023 | $4,970 | $85,709 | $22,481 | $63,228 |
| 2022 | $4,719 | $72,482 | $21,879 | $50,603 |
| 2021 | $4,610 | $72,482 | $21,879 | $50,603 |
| 2020 | $4,660 | $72,482 | $21,879 | $50,603 |
| 2019 | $4,210 | $59,413 | $17,934 | $41,479 |
| 2018 | $3,945 | $59,413 | $17,934 | $41,479 |
| 2017 | $3,723 | $59,413 | $17,934 | $41,479 |
| 2016 | $3,512 | $54,709 | $17,892 | $36,817 |
| 2015 | $3,410 | $54,709 | $17,892 | $36,817 |
| 2014 | $3,412 | $54,709 | $17,892 | $36,817 |
| 2013 | $3,165 | $53,638 | $17,542 | $36,096 |
Source: Public Records
Map
Nearby Homes
- 1682 Yellowglen Dr
- 7660 Clough Pike
- 7652 Clough Pike
- L Clough Pike
- 8190 Riovista Dr
- 2117 Berrypatch Dr
- 8413 Summitridge Dr
- 2083 Forestcrest Way
- 8022 Stonegate Dr
- 1434 Castleberry Ct
- 8032 Lancelot Dr
- 1747 Summithills Dr
- 8069 Ashgrove Dr
- 2193 Forestlake Dr
- 2067 Knightsbridge Dr
- 7827 State Rd
- 8019 Stonegate Dr
- 1380 Yellowglen Dr
- 1400 Sigma Cir
- 1363 Oak Ct
- 1815 Wanninger Ln
- 1786 Wanninger Ln
- 1850 Wanninger Ln
- 1833 Wanninger Ln
- 1787 Wanninger Ln
- 1772 Wanninger Ln
- 1851 Wanninger Ln
- 1868 Wanninger Ln
- 1771 Wanninger Ln
- 1810 Wexwood Ln
- 1822 Wexwood Ln
- 1798 Wexwood Ln
- 1834 Wexwood Ln
- 1758 Wanninger Ln
- 1788 Wexwood Ln
- 1869 Wanninger Ln
- 1846 Wexwood Ln
- 1776 Wexwood Ln
- 1759 Wanninger Ln
- 1858 Wexwood Ln