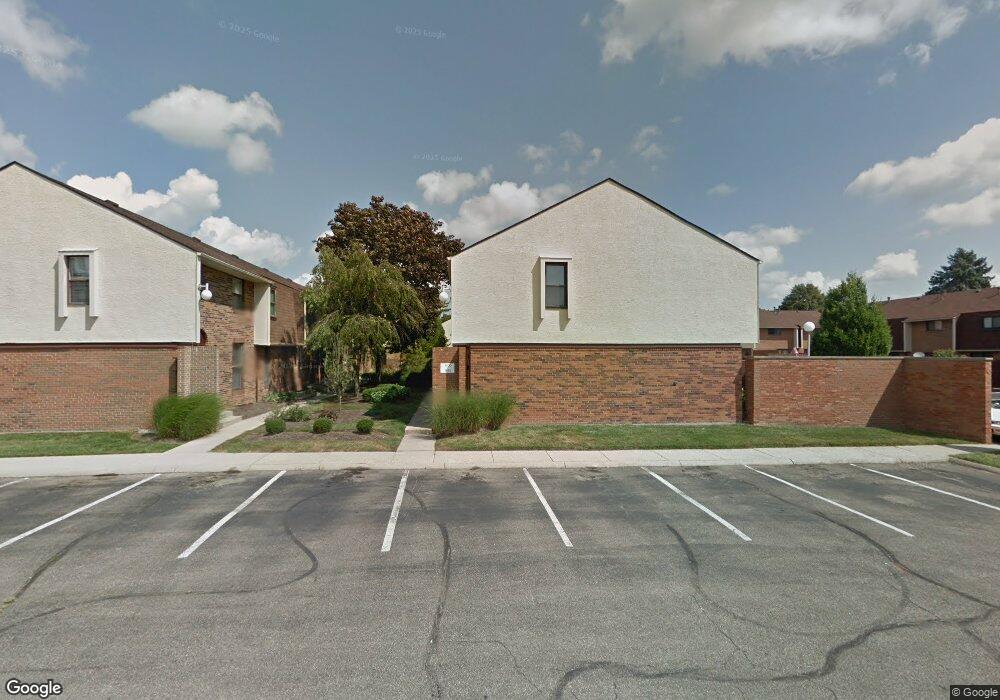
1814 Willoway Cir S Unit 1814 Columbus, OH 43220
Northcrest NeighborhoodEstimated Value: $196,000 - $208,000
2
Beds
2
Baths
992
Sq Ft
$202/Sq Ft
Est. Value
About This Home
This home is located at 1814 Willoway Cir S Unit 1814, Columbus, OH 43220 and is currently estimated at $200,351, approximately $201 per square foot. 1814 Willoway Cir S Unit 1814 is a home located in Franklin County with nearby schools including Winterset Elementary School, Ridgeview Middle School, and Centennial High School.
Ownership History
Date
Name
Owned For
Owner Type
Purchase Details
Closed on
Sep 27, 2024
Sold by
Yi Rong
Bought by
Rong-Shang Revocable Living Trust and Shang
Current Estimated Value
Purchase Details
Closed on
Sep 16, 2011
Sold by
Sines Raymond E and Sines Suanne H
Bought by
Yi Rong
Purchase Details
Closed on
Feb 10, 2001
Sold by
Jesenovec Kenneth F and Jesenovec Kathleen O
Bought by
Sines Raymond E and Sines Suanne H
Home Financials for this Owner
Home Financials are based on the most recent Mortgage that was taken out on this home.
Original Mortgage
$53,600
Interest Rate
7.1%
Mortgage Type
Purchase Money Mortgage
Purchase Details
Closed on
Apr 21, 1999
Sold by
Jesenovec Kenneth F
Bought by
Jesenovec Kenneth F and Jesenovec Kathleen O
Purchase Details
Closed on
Sep 2, 1992
Bought by
Jesenovec Kenneth F
Purchase Details
Closed on
Sep 30, 1988
Purchase Details
Closed on
Oct 16, 1987
Create a Home Valuation Report for This Property
The Home Valuation Report is an in-depth analysis detailing your home's value as well as a comparison with similar homes in the area
Home Values in the Area
Average Home Value in this Area
Purchase History
| Date | Buyer | Sale Price | Title Company |
|---|---|---|---|
| Rong-Shang Revocable Living Trust | -- | None Listed On Document | |
| Yi Rong | $72,000 | Land And Mortgage Title Box | |
| Sines Raymond E | $67,000 | Title First Agency Inc | |
| Jesenovec Kenneth F | -- | -- | |
| Jesenovec Kenneth F | $32,000 | -- | |
| -- | -- | -- | |
| -- | $36,000 | -- |
Source: Public Records
Mortgage History
| Date | Status | Borrower | Loan Amount |
|---|---|---|---|
| Previous Owner | Sines Raymond E | $53,600 |
Source: Public Records
Tax History Compared to Growth
Tax History
| Year | Tax Paid | Tax Assessment Tax Assessment Total Assessment is a certain percentage of the fair market value that is determined by local assessors to be the total taxable value of land and additions on the property. | Land | Improvement |
|---|---|---|---|---|
| 2024 | $2,529 | $51,910 | $5,600 | $46,310 |
| 2023 | $2,499 | $51,910 | $5,600 | $46,310 |
| 2022 | $2,180 | $38,190 | $5,460 | $32,730 |
| 2021 | $2,183 | $38,190 | $5,460 | $32,730 |
| 2020 | $2,186 | $38,190 | $5,460 | $32,730 |
| 2019 | $1,976 | $29,370 | $4,200 | $25,170 |
| 2018 | $1,762 | $29,370 | $4,200 | $25,170 |
| 2017 | $1,876 | $29,370 | $4,200 | $25,170 |
| 2016 | $1,698 | $24,260 | $4,130 | $20,130 |
| 2015 | $1,551 | $24,260 | $4,130 | $20,130 |
| 2014 | $1,504 | $24,260 | $4,130 | $20,130 |
| 2013 | $802 | $26,950 | $4,585 | $22,365 |
Source: Public Records
Map
Nearby Homes
- 1835 Willoway Cir N
- 1865 Willoway Cir N Unit 1865
- 4924 Reed Rd Unit B
- 1739 Paula Dr Unit 1739
- 4740 Merrifield Place Unit 25
- 5111 Schuylkill St
- 1558 Denbigh Dr
- 5111 Portland St
- 5268 Captains Ct
- 2165 Partlow Dr
- 1466 Weybridge Rd
- 4781 Coach Rd
- 4818 -4820 Winterset Dr
- 2198 Sandston Rd
- 1594 Lafayette Dr Unit 1594
- 1610 Lafayette Dr Unit 1610
- 2172 Hedgerow Rd Unit 2172G
- 2231 Atlee Ct Unit 12
- 1512 Lafayette Dr Unit B
- 2248 Sandover Rd
- 1812 Willoway Cir S Unit 1812
- 1810 Willoway Cir S
- 1816 Willoway Cir S
- 1822 Willoway Cir S
- 1818 Willoway Cir S
- 1820 Willoway Cir S Unit BLDG
- 1808 Willoway Cir S Unit 1808
- 1826 Willoway Cir S Unit 1826
- 1806 Willoway Cir S Unit 1806
- 1804 Willoway Cir S Unit 1804
- 1804 Willoway Cir S Unit BLDG
- 1828 Willoway Cir S Unit 1828
- 1830 Willoway Cir S Unit 1830
- 1776 Willoway Cir S Unit 1776
- 1798 Willoway Cir S
- 1802 Willoway Cir S Unit 1802
- 1802 Willoway Cir S Unit 29
- 1782 Willoway Cir S Unit 1782
- 1782 Willoway Cir S Unit Bldg
- 1770 Willoway Cir S Unit 1770