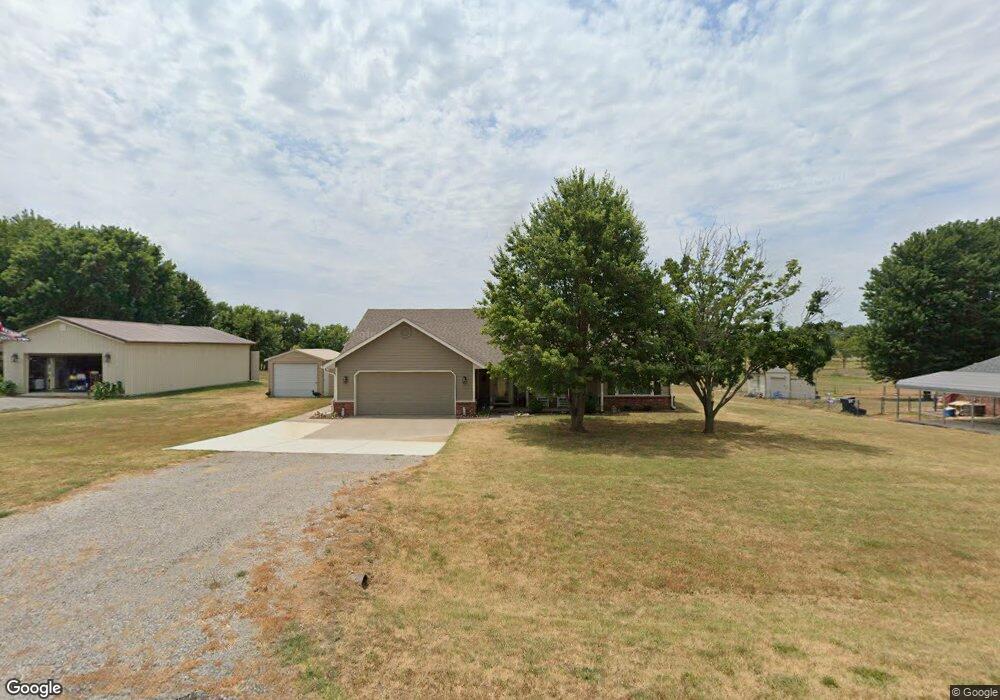
18142 Quail Creek Rd Claremore, OK 74017
Estimated Value: $246,299 - $292,000
3
Beds
2
Baths
1,616
Sq Ft
$168/Sq Ft
Est. Value
About This Home
This home is located at 18142 Quail Creek Rd, Claremore, OK 74017 and is currently estimated at $271,575, approximately $168 per square foot. 18142 Quail Creek Rd is a home located in Rogers County with nearby schools including Sequoyah Elementary School, Sequoyah High School, and Claremore Christian School.
Ownership History
Date
Name
Owned For
Owner Type
Purchase Details
Closed on
Nov 29, 2022
Sold by
Freidline Wayne C and Freidlin Elma
Bought by
Church Noah P
Current Estimated Value
Purchase Details
Closed on
Sep 18, 2020
Sold by
Freidline Elina Jean
Bought by
Freidline Elina Jean and Freidline Wayne C
Purchase Details
Closed on
Aug 18, 2017
Sold by
Church Daniel E and Church Dawna
Bought by
Freidline Wayne C and Freidline Elma Jean
Purchase Details
Closed on
Oct 24, 2007
Sold by
West Suzanne Marie
Bought by
Church Dawna K and Church Daniel E
Home Financials for this Owner
Home Financials are based on the most recent Mortgage that was taken out on this home.
Original Mortgage
$155,558
Interest Rate
6.42%
Mortgage Type
FHA
Purchase Details
Closed on
Sep 17, 2003
Sold by
West Edward D
Purchase Details
Closed on
May 30, 1997
Sold by
Griggs Ronnie J
Purchase Details
Closed on
Jul 18, 1996
Sold by
Stimson Terrance J
Purchase Details
Closed on
Nov 15, 1993
Sold by
Flynn Huey I
Create a Home Valuation Report for This Property
The Home Valuation Report is an in-depth analysis detailing your home's value as well as a comparison with similar homes in the area
Home Values in the Area
Average Home Value in this Area
Purchase History
| Date | Buyer | Sale Price | Title Company |
|---|---|---|---|
| Church Noah P | -- | -- | |
| Freidline Elina Jean | -- | None Available | |
| Freidline Wayne C | $170,000 | Apex Title & Closing Service | |
| Church Dawna K | $158,000 | Century Title | |
| -- | -- | -- | |
| -- | $93,000 | -- | |
| -- | $12,000 | -- | |
| -- | $90,000 | -- |
Source: Public Records
Mortgage History
| Date | Status | Borrower | Loan Amount |
|---|---|---|---|
| Previous Owner | Church Dawna K | $155,558 |
Source: Public Records
Tax History Compared to Growth
Tax History
| Year | Tax Paid | Tax Assessment Tax Assessment Total Assessment is a certain percentage of the fair market value that is determined by local assessors to be the total taxable value of land and additions on the property. | Land | Improvement |
|---|---|---|---|---|
| 2025 | $1,516 | $18,164 | $5,303 | $12,861 |
| 2024 | $1,522 | $18,164 | $4,938 | $13,226 |
| 2023 | $1,522 | $18,164 | $4,123 | $14,041 |
| 2022 | $1,575 | $18,164 | $3,342 | $14,822 |
| 2021 | $1,514 | $18,164 | $3,607 | $14,557 |
| 2020 | $1,563 | $18,164 | $3,662 | $14,502 |
| 2019 | $1,537 | $18,164 | $3,850 | $14,314 |
| 2018 | $1,596 | $18,606 | $3,850 | $14,756 |
| 2017 | $1,559 | $18,467 | $3,850 | $14,617 |
| 2016 | $1,684 | $19,946 | $3,850 | $16,096 |
| 2015 | $1,701 | $19,439 | $3,850 | $15,589 |
| 2014 | $1,649 | $18,873 | $3,850 | $15,023 |
Source: Public Records
Map
Nearby Homes
- 13414 E 463 Rd
- 17995 S 4160 Rd
- 2701 Spring Creek St
- 18774 S Birch Hollow Way
- 18954 S Hisaw Dr
- 18910 S Canyon Creek Rd
- 17090 S 4170 Rd
- 14800 Cedar Dr
- E E 470 Rd
- 17791 S 4180 Rd
- 19434 S Quail Run Ct
- 531 Buckingham Dr
- 1921 Bristol Rd
- 9251 E 470 Rd
- 19805 S Lake Dr
- 17811 S 4150 Rd
- 18723 S 4185 Rd Unit A
- 11971 Stonehedge Dr
- 11901 Laurel Ln
- 326 E 15th St
- 18102 Quail Creek Rd
- 18172 Quail Creek Rd
- 18155 Quail Creek Rd
- 18202 Quail Creek Rd
- 18072 Quail Creek Rd
- 18105 Quail Creek Rd
- 18175 Quail Creek Rd
- 18440 Quail Creek Rd
- 18446 Quail Creek Rd
- null Quail Creek Rd
- 18205 Quail Creek Rd
- 18075 Quail Creek Rd
- 18222 Quail Creek Rd
- 18052 Quail Creek Rd
- 18055 Quail Creek Rd
- 18215 Quail Creek Rd
- 18045 Quail Creek Rd
- 0 Quail Creek Rd
- 18144 S Quail Meadow Dr
- 18032 Quail Creek Rd