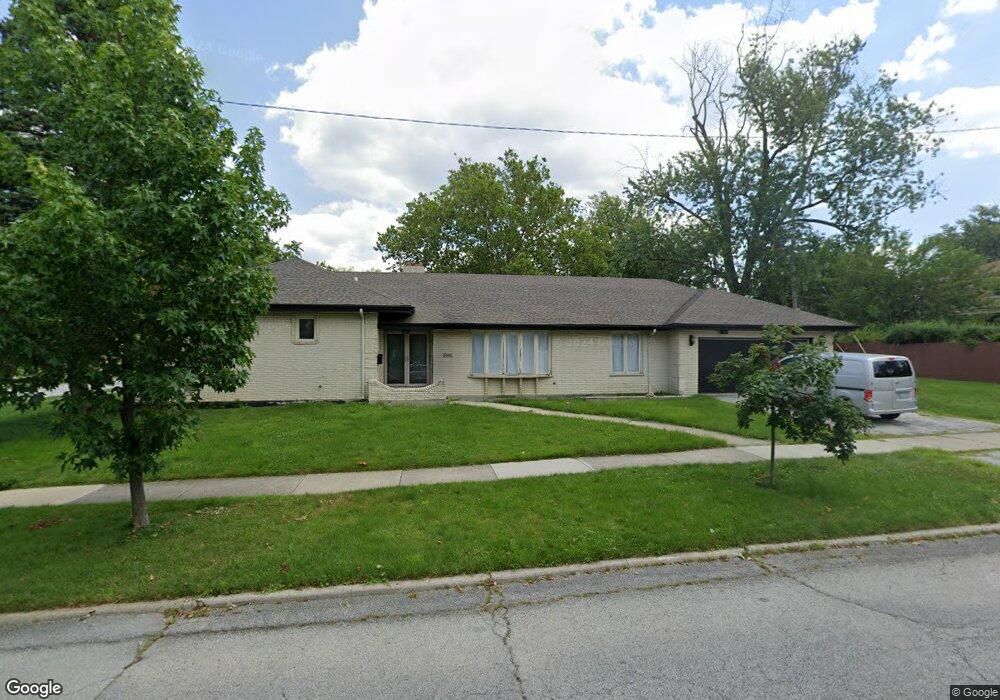
18145 Gottschalk Ave Homewood, IL 60430
Estimated Value: $302,000 - $408,000
3
Beds
2
Baths
2,031
Sq Ft
$170/Sq Ft
Est. Value
About This Home
This home is located at 18145 Gottschalk Ave, Homewood, IL 60430 and is currently estimated at $344,592, approximately $169 per square foot. 18145 Gottschalk Ave is a home located in Cook County with nearby schools including Willow Elementary School, Winston Churchill School, and James Hart School.
Ownership History
Date
Name
Owned For
Owner Type
Purchase Details
Closed on
May 12, 2010
Sold by
Guaranteed Rate Inc
Bought by
Chinwah Melissa
Current Estimated Value
Home Financials for this Owner
Home Financials are based on the most recent Mortgage that was taken out on this home.
Original Mortgage
$137,159
Outstanding Balance
$93,934
Interest Rate
5.5%
Mortgage Type
FHA
Estimated Equity
$250,658
Purchase Details
Closed on
Sep 15, 2009
Sold by
Guaranteed Rate Inc
Bought by
United States Receivers Caretakers Assoc
Purchase Details
Closed on
Jun 13, 2008
Sold by
Johns Alex
Bought by
Guaranteed Rate Inc
Purchase Details
Closed on
Mar 31, 2005
Sold by
Bovino Frank S
Bought by
Johns Alex
Home Financials for this Owner
Home Financials are based on the most recent Mortgage that was taken out on this home.
Original Mortgage
$143,100
Interest Rate
9.1%
Mortgage Type
Unknown
Create a Home Valuation Report for This Property
The Home Valuation Report is an in-depth analysis detailing your home's value as well as a comparison with similar homes in the area
Home Values in the Area
Average Home Value in this Area
Purchase History
| Date | Buyer | Sale Price | Title Company |
|---|---|---|---|
| Chinwah Melissa | $160,000 | Chicago Title Insurance Co | |
| United States Receivers Caretakers Assoc | -- | None Available | |
| United States Receivers Caretakers Assoc | -- | None Available | |
| Guaranteed Rate Inc | -- | Chicago Title Insurance Co | |
| Johns Alex | $159,000 | -- |
Source: Public Records
Mortgage History
| Date | Status | Borrower | Loan Amount |
|---|---|---|---|
| Open | Chinwah Melissa | $137,159 | |
| Previous Owner | Johns Alex | $143,100 |
Source: Public Records
Tax History Compared to Growth
Tax History
| Year | Tax Paid | Tax Assessment Tax Assessment Total Assessment is a certain percentage of the fair market value that is determined by local assessors to be the total taxable value of land and additions on the property. | Land | Improvement |
|---|---|---|---|---|
| 2024 | $11,435 | $30,000 | $3,340 | $26,660 |
| 2023 | $10,745 | $30,000 | $3,340 | $26,660 |
| 2022 | $10,745 | $23,450 | $2,923 | $20,527 |
| 2021 | $10,064 | $23,449 | $2,922 | $20,527 |
| 2020 | $9,853 | $23,449 | $2,922 | $20,527 |
| 2019 | $9,052 | $21,458 | $2,714 | $18,744 |
| 2018 | $8,759 | $21,458 | $2,714 | $18,744 |
| 2017 | $8,797 | $21,458 | $2,714 | $18,744 |
| 2016 | $7,989 | $18,587 | $2,505 | $16,082 |
| 2015 | $7,852 | $18,587 | $2,505 | $16,082 |
| 2014 | $6,845 | $18,587 | $2,505 | $16,082 |
| 2013 | $8,126 | $20,968 | $2,505 | $18,463 |
Source: Public Records
Map
Nearby Homes
- 1852 Sycamore Rd
- 18241 Gottschalk Ave
- 1728 Olive Rd
- 1940 183rd St Unit 1C
- 1940 183rd St Unit 1D
- 18137 Martin Ave Unit 1NE
- 1750 183rd St
- 17919 Homewood Ave
- 1741 Evergreen Rd
- 1655 183rd St
- 1850 Pine Rd
- 1554 Olive Rd
- 1758 Pine Rd
- 1617 183rd St
- 18104 Park Ave
- 17833 Harwood Ave
- 1607 183rd St
- 1624 Burr Oak Rd
- 1525 Burr Oak Rd
- 18462 Dixie Hwy
- 1863 Sycamore Rd
- 18165 Gottschalk Ave
- 1866 Olive Rd
- 1859 Sycamore Rd
- 18148 Gottschalk Ave
- 1862 Olive Rd
- 18144 Gottschalk Ave
- 18135 Gottschalk Ave
- 18160 Gottschalk Ave
- 1853 Sycamore Rd
- 1900 Sycamore Rd
- 1856 Olive Rd
- 18136 Gottschalk Ave
- 1862 Sycamore Rd
- 18164 Gottschalk Ave
- 1856 Sycamore Rd
- 1919 Hickory Rd
- 1847 Sycamore Rd
- 1848 Olive Rd
- 1844 Sycamore Rd