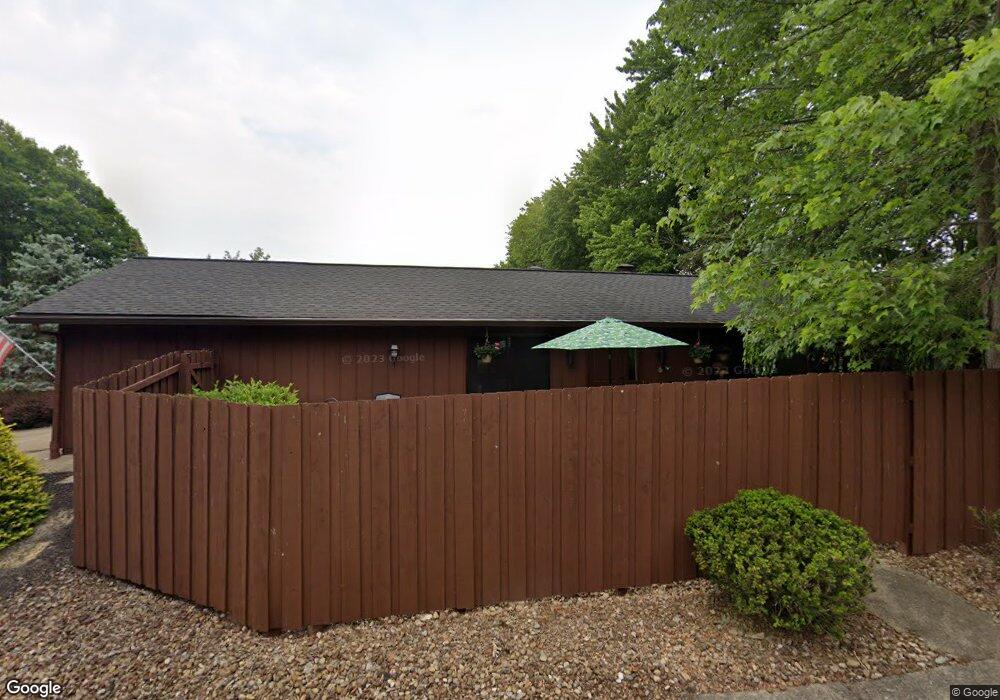
18146 Trailside Place Unit 4097 Strongsville, OH 44136
Estimated Value: $252,000 - $289,000
2
Beds
2
Baths
1,347
Sq Ft
$198/Sq Ft
Est. Value
About This Home
This home is located at 18146 Trailside Place Unit 4097, Strongsville, OH 44136 and is currently estimated at $267,015, approximately $198 per square foot. 18146 Trailside Place Unit 4097 is a home located in Cuyahoga County with nearby schools including Strongsville High School and Sts Joseph & John Interparochial School.
Ownership History
Date
Name
Owned For
Owner Type
Purchase Details
Closed on
Mar 15, 1999
Sold by
Fish Caroline
Bought by
Bodrock Andrew J and Bodrock Susan C
Current Estimated Value
Home Financials for this Owner
Home Financials are based on the most recent Mortgage that was taken out on this home.
Original Mortgage
$93,500
Outstanding Balance
$22,726
Interest Rate
6.8%
Estimated Equity
$244,289
Purchase Details
Closed on
Dec 1, 1987
Sold by
Schultz Eulalie U
Bought by
Fish Caroline
Purchase Details
Closed on
May 29, 1985
Sold by
Schultz Eulalie U and Schultz Arthur L
Bought by
Schultz Eulalie U
Purchase Details
Closed on
Aug 24, 1983
Sold by
Moyer Gilbert B
Bought by
Schultz Eulalie U and Schultz Arthur L
Purchase Details
Closed on
Oct 12, 1979
Sold by
Gulmi Henry C and J S
Bought by
Moyer Gilbert B
Purchase Details
Closed on
Jan 1, 1976
Bought by
Gulmi Henry C and J S
Create a Home Valuation Report for This Property
The Home Valuation Report is an in-depth analysis detailing your home's value as well as a comparison with similar homes in the area
Home Values in the Area
Average Home Value in this Area
Purchase History
| Date | Buyer | Sale Price | Title Company |
|---|---|---|---|
| Bodrock Andrew J | $123,500 | Chicago Title | |
| Fish Caroline | $84,000 | -- | |
| Schultz Eulalie U | -- | -- | |
| Schultz Eulalie U | $77,000 | -- | |
| Moyer Gilbert B | $74,900 | -- | |
| Gulmi Henry C | -- | -- |
Source: Public Records
Mortgage History
| Date | Status | Borrower | Loan Amount |
|---|---|---|---|
| Open | Bodrock Andrew J | $93,500 |
Source: Public Records
Tax History Compared to Growth
Tax History
| Year | Tax Paid | Tax Assessment Tax Assessment Total Assessment is a certain percentage of the fair market value that is determined by local assessors to be the total taxable value of land and additions on the property. | Land | Improvement |
|---|---|---|---|---|
| 2024 | $2,927 | $72,135 | $7,070 | $65,065 |
| 2023 | $2,523 | $49,460 | $4,940 | $44,520 |
| 2022 | $2,531 | $49,455 | $4,935 | $44,520 |
| 2021 | $2,511 | $49,460 | $4,940 | $44,520 |
| 2020 | $2,003 | $37,490 | $3,750 | $33,740 |
| 2019 | $1,945 | $107,100 | $10,700 | $96,400 |
| 2018 | $1,765 | $37,490 | $3,750 | $33,740 |
| 2017 | $1,802 | $35,910 | $3,570 | $32,340 |
| 2016 | $1,787 | $35,910 | $3,570 | $32,340 |
| 2015 | $1,993 | $35,910 | $3,570 | $32,340 |
| 2014 | $1,993 | $38,610 | $3,850 | $34,760 |
Source: Public Records
Map
Nearby Homes
- 17945 Cliffside Dr
- 17809 Cliffside Dr Unit 4926
- 18336 Falling Water Rd
- 18248 Meadow Ln
- 11650 River Moss Rd
- 12101 The Bluffs
- 17289 Akita Ct Unit 4508
- 11479 Pearl Rd Unit A101
- 11499 Pearl Rd Unit A106
- 13513 Suncrest Ct
- 11432 Pearl Rd
- 13099 Olympus Way
- 12539 Olympus Way
- 13066 Olympus Way
- 13156 Olympus Way
- 19240 Briarwood Ln
- 12385 Corinth Ct
- 16519 Albion Rd
- 19160 Wheelers Ln
- 11179 Fawn Meadow Ln
- 18133 Cliffside Dr
- 18133 Cliffside Dr Unit 4908
- 18111 Cliffside Dr Unit 4909
- 18101 Cliffside Dr
- 18153 Trailside Place
- 18153 Trailside Place Unit 4905
- 18161 Trailside Place
- 18023 Cliffside Dr
- 18023 Cliffside Dr Unit 4911
- 18068 Bonnie Ln
- 18175 Trailside Place Unit 4902
- 18175 Trailside Place
- 18026 Bonnie Ln
- 18042 Ledgepoint Place Unit 4948
- 18110 Bonnie Ln
- 18056 Ledgepoint Place Unit 4947
- 18036 Ledgepoint Place
- 18016 Cliffside Dr
- 18016 Cliffside Dr Unit 4912
- 18018 Bonnie Ln