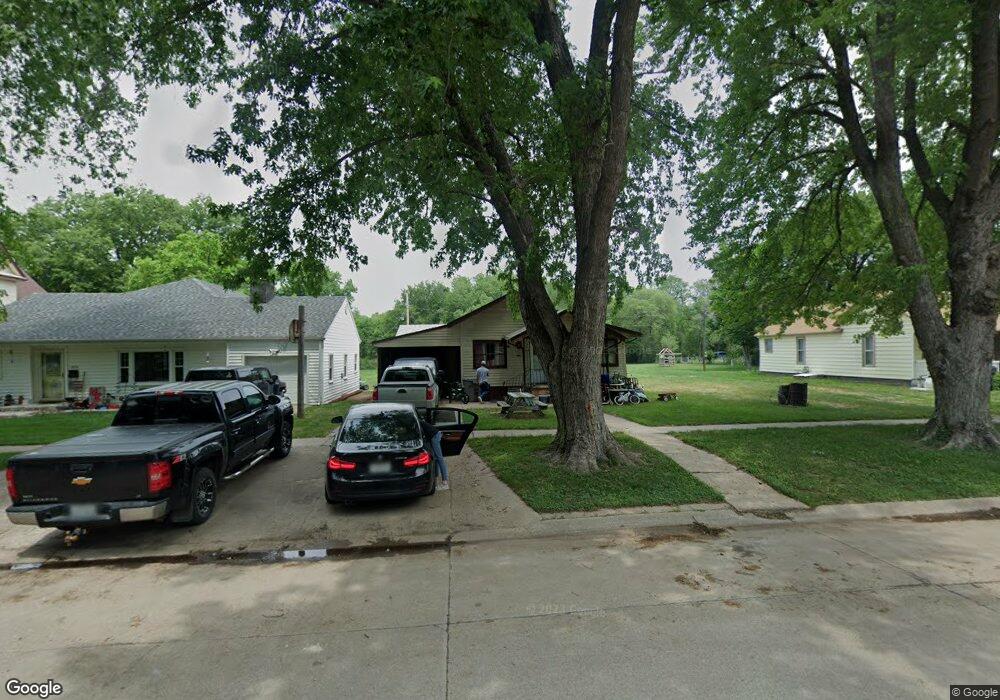
1815 12th St Central City, NE 68826
Estimated Value: $117,000 - $152,000
3
Beds
1
Bath
1,128
Sq Ft
$121/Sq Ft
Est. Value
About This Home
This home is located at 1815 12th St, Central City, NE 68826 and is currently estimated at $136,793, approximately $121 per square foot. 1815 12th St is a home located in Merrick County with nearby schools including Central City Elementary School, Central City Middle School, and Central City High School.
Ownership History
Date
Name
Owned For
Owner Type
Purchase Details
Closed on
Mar 8, 2024
Sold by
Hedglin Nancy
Bought by
Hedglin Nancy and Hedglin Laurence
Current Estimated Value
Home Financials for this Owner
Home Financials are based on the most recent Mortgage that was taken out on this home.
Original Mortgage
$11,026
Outstanding Balance
$9,727
Interest Rate
6.63%
Mortgage Type
New Conventional
Estimated Equity
$127,066
Create a Home Valuation Report for This Property
The Home Valuation Report is an in-depth analysis detailing your home's value as well as a comparison with similar homes in the area
Home Values in the Area
Average Home Value in this Area
Purchase History
| Date | Buyer | Sale Price | Title Company |
|---|---|---|---|
| Hedglin Nancy | -- | None Listed On Document |
Source: Public Records
Mortgage History
| Date | Status | Borrower | Loan Amount |
|---|---|---|---|
| Open | Hedglin Nancy | $11,026 |
Source: Public Records
Tax History Compared to Growth
Tax History
| Year | Tax Paid | Tax Assessment Tax Assessment Total Assessment is a certain percentage of the fair market value that is determined by local assessors to be the total taxable value of land and additions on the property. | Land | Improvement |
|---|---|---|---|---|
| 2025 | $911 | $77,310 | $39,205 | $38,105 |
| 2024 | $911 | $75,565 | $37,460 | $38,105 |
| 2023 | $686 | $47,410 | $19,165 | $28,245 |
| 2022 | $779 | $47,410 | $19,165 | $28,245 |
| 2021 | $739 | $42,665 | $19,165 | $23,500 |
| 2020 | $724 | $41,765 | $19,165 | $22,600 |
| 2019 | $467 | $27,220 | $4,620 | $22,600 |
| 2018 | $469 | $27,220 | $4,620 | $22,600 |
| 2017 | $471 | $27,220 | $4,620 | $22,600 |
| 2016 | $585 | $33,700 | $4,620 | $29,080 |
| 2015 | $629 | $33,700 | $4,620 | $29,080 |
| 2014 | $654 | $33,700 | $4,620 | $29,080 |
| 2012 | $372 | $35,390 | $4,620 | $30,770 |
Source: Public Records
Map
Nearby Homes