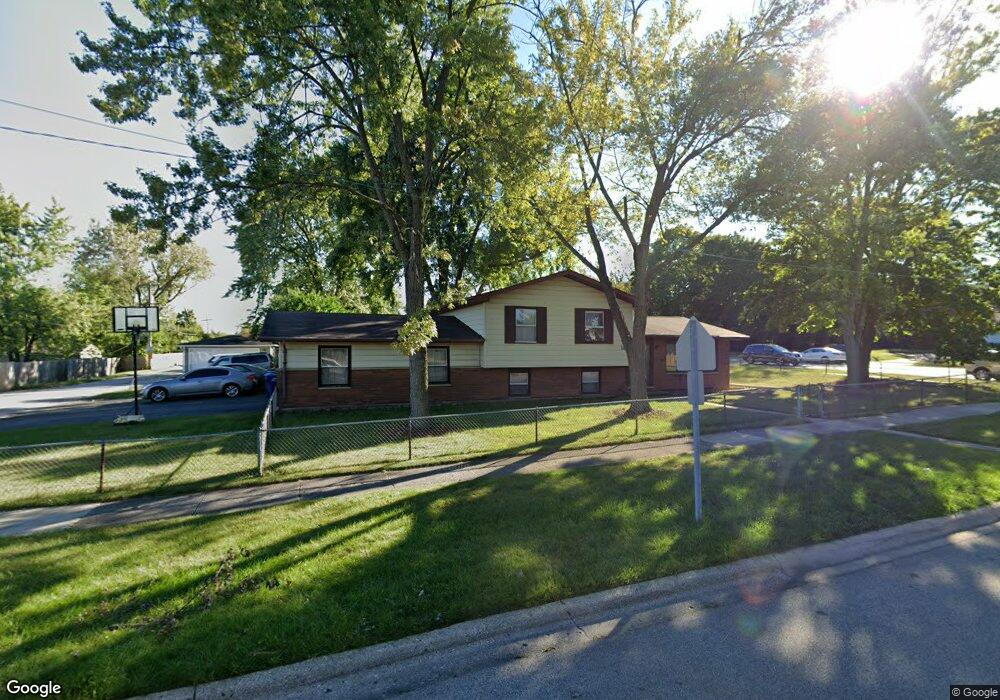
1815 Blanchard Rd Waukegan, IL 60087
Lake County Gardens NeighborhoodEstimated Value: $213,000 - $277,425
4
Beds
2
Baths
2,700
Sq Ft
$97/Sq Ft
Est. Value
About This Home
This home is located at 1815 Blanchard Rd, Waukegan, IL 60087 and is currently estimated at $260,856, approximately $96 per square foot. 1815 Blanchard Rd is a home located in Lake County with nearby schools including Little Fort Elementary School, Jack Benny Middle School, and Waukegan High School.
Ownership History
Date
Name
Owned For
Owner Type
Purchase Details
Closed on
May 2, 2008
Sold by
Us Bank Na
Bought by
Macrowski Philip and Gonzalez Jessica
Current Estimated Value
Home Financials for this Owner
Home Financials are based on the most recent Mortgage that was taken out on this home.
Original Mortgage
$123,793
Interest Rate
6.04%
Mortgage Type
FHA
Purchase Details
Closed on
Aug 23, 2007
Sold by
Richard Eldridge and Case #06 Ch 2590
Bought by
Us Bank Na
Purchase Details
Closed on
Dec 3, 1996
Sold by
Richard Eldridge
Bought by
Richard Eldridge and Richard Chris J
Purchase Details
Closed on
Dec 4, 1995
Sold by
Ward David C and David C Ward Revocable Living
Bought by
Richard Eldridge
Home Financials for this Owner
Home Financials are based on the most recent Mortgage that was taken out on this home.
Original Mortgage
$118,916
Interest Rate
7.52%
Mortgage Type
FHA
Purchase Details
Closed on
Aug 19, 1994
Sold by
Ward David C
Bought by
Ward David C and The David C Ward Revocable Liv
Create a Home Valuation Report for This Property
The Home Valuation Report is an in-depth analysis detailing your home's value as well as a comparison with similar homes in the area
Home Values in the Area
Average Home Value in this Area
Purchase History
| Date | Buyer | Sale Price | Title Company |
|---|---|---|---|
| Macrowski Philip | $125,000 | First American Title Ins | |
| Us Bank Na | -- | None Available | |
| Richard Eldridge | -- | -- | |
| Richard Eldridge | $120,000 | Chicago Title Insurance Co | |
| Ward David C | -- | -- |
Source: Public Records
Mortgage History
| Date | Status | Borrower | Loan Amount |
|---|---|---|---|
| Previous Owner | Macrowski Philip | $123,793 | |
| Previous Owner | Richard Eldridge | $118,916 |
Source: Public Records
Tax History Compared to Growth
Tax History
| Year | Tax Paid | Tax Assessment Tax Assessment Total Assessment is a certain percentage of the fair market value that is determined by local assessors to be the total taxable value of land and additions on the property. | Land | Improvement |
|---|---|---|---|---|
| 2024 | $5,199 | $73,729 | $12,609 | $61,120 |
| 2023 | $5,521 | $63,140 | $10,798 | $52,342 |
| 2022 | $5,521 | $62,471 | $10,893 | $51,578 |
| 2021 | $5,534 | $59,084 | $10,223 | $48,861 |
| 2020 | $5,559 | $55,044 | $9,524 | $45,520 |
| 2019 | $5,542 | $50,439 | $8,727 | $41,712 |
| 2018 | $4,335 | $39,908 | $10,107 | $29,801 |
| 2017 | $4,169 | $35,308 | $8,942 | $26,366 |
| 2016 | $3,814 | $30,681 | $7,770 | $22,911 |
| 2015 | $3,625 | $27,460 | $6,954 | $20,506 |
| 2014 | $3,629 | $26,988 | $5,111 | $21,877 |
| 2012 | $4,370 | $29,239 | $5,538 | $23,701 |
Source: Public Records
Map
Nearby Homes
- 2613 N Lewis Ave
- 2350 N Lewis Ave
- 1612 Whitney St
- 1636 Rice St
- 2705 Dana Ave
- 2708 Dana Ave
- 2232 Walnut St
- 2713 Varonen Ave
- 3211 Rugby Ct
- 12312 W Audrey Ave
- 3101 Country Club Ln
- 1913 Chippewa Rd
- 37966 N Cornell Rd
- 2440 W Cheyenne Rd
- 1905 Linden Ave
- 3411 N Lewis Ave
- 301 W Eagle Ct
- 2207 Williamsburg Dr
- 37905 N Loyola Ave
- 36955 N Garrick Ave
- 2529 N Lewis Ave
- 2525 N Lewis Ave
- 1801 Blanchard Rd
- 2528 N Elmwood Ave
- 2605 N Lewis Ave
- 1808 Blanchard Rd
- 2524 N Elmwood Ave
- 2521 N Lewis Ave
- 2520 N Elmwood Ave
- 2546 N Lewis Ave
- 1804 Blanchard Rd
- 2540 N Lewis Ave
- 2609 N Lewis Ave Unit 4
- 2600 N Lewis Ave
- 2516 N Elmwood Ave
- 1800 Blanchard Rd
- 2608 N Lewis Ave
- 1743 Dickinson St
- 2513 N Lewis Ave
- 2524 N Lewis Ave