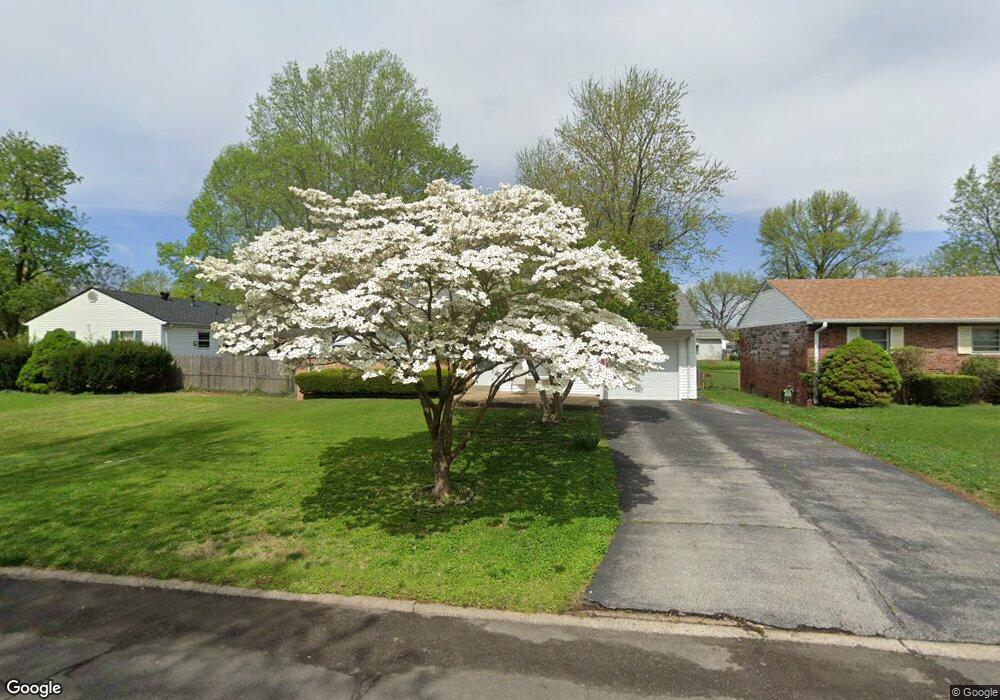
1815 Curtis Ct Florissant, MO 63031
Estimated Value: $148,000 - $159,991
3
Beds
2
Baths
864
Sq Ft
$175/Sq Ft
Est. Value
About This Home
This home is located at 1815 Curtis Ct, Florissant, MO 63031 and is currently estimated at $150,998, approximately $174 per square foot. 1815 Curtis Ct is a home located in St. Louis County with nearby schools including Walker Elementary School, Northwest Middle School, and Hazelwood West High School.
Ownership History
Date
Name
Owned For
Owner Type
Purchase Details
Closed on
Nov 12, 2008
Sold by
Accredited Home Lenders Inc
Bought by
Broyles James
Current Estimated Value
Home Financials for this Owner
Home Financials are based on the most recent Mortgage that was taken out on this home.
Original Mortgage
$69,495
Outstanding Balance
$45,392
Interest Rate
5.98%
Mortgage Type
FHA
Estimated Equity
$105,606
Purchase Details
Closed on
Aug 21, 2008
Sold by
Misbauer Chadwick E and Misbauer Jessica A
Bought by
Accredited Home Lenders Inc
Purchase Details
Closed on
Jun 17, 2004
Sold by
Headrick Jerry Kenneth and Headrick Kathleen Lee
Bought by
Misbauer Chadwick E and Misbauer Jessica A
Home Financials for this Owner
Home Financials are based on the most recent Mortgage that was taken out on this home.
Original Mortgage
$104,362
Interest Rate
6.62%
Mortgage Type
FHA
Create a Home Valuation Report for This Property
The Home Valuation Report is an in-depth analysis detailing your home's value as well as a comparison with similar homes in the area
Home Values in the Area
Average Home Value in this Area
Purchase History
| Date | Buyer | Sale Price | Title Company |
|---|---|---|---|
| Broyles James | $72,900 | None Available | |
| Accredited Home Lenders Inc | $80,000 | None Available | |
| Misbauer Chadwick E | $106,000 | Capital Title |
Source: Public Records
Mortgage History
| Date | Status | Borrower | Loan Amount |
|---|---|---|---|
| Open | Broyles James | $69,495 | |
| Previous Owner | Misbauer Chadwick E | $104,362 | |
| Closed | Accredited Home Lenders Inc | -- |
Source: Public Records
Tax History Compared to Growth
Tax History
| Year | Tax Paid | Tax Assessment Tax Assessment Total Assessment is a certain percentage of the fair market value that is determined by local assessors to be the total taxable value of land and additions on the property. | Land | Improvement |
|---|---|---|---|---|
| 2025 | $2,096 | $26,430 | $5,850 | $20,580 |
| 2024 | $2,096 | $23,330 | $3,000 | $20,330 |
| 2023 | $2,093 | $23,330 | $3,000 | $20,330 |
| 2022 | $1,943 | $19,300 | $3,340 | $15,960 |
| 2021 | $1,893 | $19,300 | $3,340 | $15,960 |
| 2020 | $1,823 | $17,500 | $3,000 | $14,500 |
| 2019 | $1,795 | $17,500 | $3,000 | $14,500 |
| 2018 | $1,515 | $13,550 | $2,890 | $10,660 |
| 2017 | $1,514 | $13,550 | $2,890 | $10,660 |
| 2016 | $1,459 | $12,870 | $2,890 | $9,980 |
| 2015 | $1,428 | $12,870 | $2,890 | $9,980 |
| 2014 | $1,608 | $14,970 | $3,400 | $11,570 |
Source: Public Records
Map
Nearby Homes
- 915 Iris Dr
- 660 Crabapple Ln
- 1150 Verlene Dr
- 685 Mullanphy Rd
- 1120 Bluebird Dr
- 890 Tyson Dr
- 1700 Patterson Rd
- 1155 Mullanphy Rd
- 665 Redwing Dr
- 1480 Vesper Dr
- 1540 Angelus Dr
- 2186 Aristocrat Dr
- 670 Starlet Dr
- 2255 Collier Dr
- 2320 Patterson Rd
- 1395 Bluebird Dr
- 1075 Lees Ln
- 25 Hammes Dr
- 14 Longhenrich Dr
- 405 Wren Dr