Estimated Value: $466,000 - $517,000
4
Beds
3
Baths
1,865
Sq Ft
$262/Sq Ft
Est. Value
About This Home
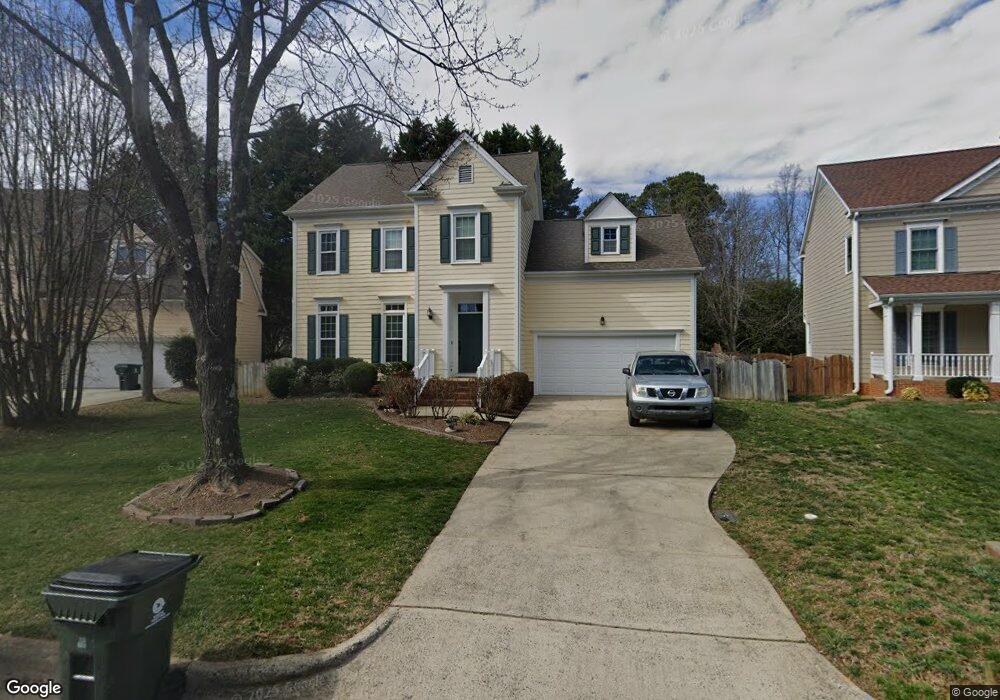
This home is located at 1815 Misty Hollow Ln, Apex, NC 27502 and is currently estimated at $488,909, approximately $262 per square foot. 1815 Misty Hollow Ln is a home located in Wake County with nearby schools including Penny Road Elementary School, Apex Middle, and Apex High School.
Ownership History
Date
Name
Owned For
Owner Type
Purchase Details
Closed on
Mar 5, 2013
Sold by
Ballengee Brandon Lee and Ballengee Lora S
Bought by
Greco John William and Fiori-Greco Jennifer Ann
Current Estimated Value
Home Financials for this Owner
Home Financials are based on the most recent Mortgage that was taken out on this home.
Original Mortgage
$148,000
Outstanding Balance
$103,918
Interest Rate
3.43%
Mortgage Type
New Conventional
Estimated Equity
$384,991
Purchase Details
Closed on
Nov 4, 2011
Sold by
Rubie Michael J and Rubie Trudy S
Bought by
Ballengee Brandon Lee and Ballengee Lora S
Home Financials for this Owner
Home Financials are based on the most recent Mortgage that was taken out on this home.
Original Mortgage
$195,498
Interest Rate
4.25%
Mortgage Type
FHA
Create a Home Valuation Report for This Property
The Home Valuation Report is an in-depth analysis detailing your home's value as well as a comparison with similar homes in the area
Home Values in the Area
Average Home Value in this Area
Purchase History
| Date | Buyer | Sale Price | Title Company |
|---|---|---|---|
| Greco John William | $185,000 | None Available | |
| Ballengee Brandon Lee | $183,500 | None Available |
Source: Public Records
Mortgage History
| Date | Status | Borrower | Loan Amount |
|---|---|---|---|
| Open | Greco John William | $148,000 | |
| Previous Owner | Ballengee Brandon Lee | $195,498 |
Source: Public Records
Tax History Compared to Growth
Tax History
| Year | Tax Paid | Tax Assessment Tax Assessment Total Assessment is a certain percentage of the fair market value that is determined by local assessors to be the total taxable value of land and additions on the property. | Land | Improvement |
|---|---|---|---|---|
| 2025 | $4,029 | $459,112 | $180,000 | $279,112 |
| 2024 | $3,939 | $459,112 | $180,000 | $279,112 |
| 2023 | $3,286 | $297,739 | $90,000 | $207,739 |
| 2022 | $3,085 | $297,739 | $90,000 | $207,739 |
| 2021 | $2,968 | $297,739 | $90,000 | $207,739 |
| 2020 | $2,938 | $297,739 | $90,000 | $207,739 |
| 2019 | $2,844 | $248,655 | $90,000 | $158,655 |
| 2018 | $2,679 | $248,655 | $90,000 | $158,655 |
| 2017 | $2,494 | $248,655 | $90,000 | $158,655 |
| 2016 | $2,458 | $248,655 | $90,000 | $158,655 |
| 2015 | $2,217 | $218,707 | $60,000 | $158,707 |
| 2014 | $2,137 | $218,707 | $60,000 | $158,707 |
Source: Public Records
Map
Nearby Homes
- 1511 Waterland Dr
- 809 Green Passage Ln
- 2003 Chedington Dr
- 1209 Waterford Green Dr
- 214 Williams Grove Ln Unit Lot 4
- 218 Williams Grove Ln
- 226 Williams Grove Ln
- 262 Williams Grove Ln Unit Lot 76
- 278 Williams Grove Ln Unit Lot 73
- 286 Williams Grove Ln Unit Lot 71
- 294 Williams Grove Ln Unit 69
- 294 Williams Grove Ln
- 298 Williams Grove Ln N Unit 68
- 265 Williams Grove Ln
- 273 Williams Grove Ln Unit Lot 62
- 281 Williams Grove Ln Unit Lot 64
- 281 Williams Grove Ln
- 285 Williams Grove Ln Unit Lot 65
- 295 Williams Grove Ln Unit Lot 67
- 644 Angelica Cir
- 1813 Misty Hollow Ln
- 1817 Misty Hollow Ln
- 1811 Misty Hollow Ln
- 1819 Misty Hollow Ln
- 1814 Misty Hollow Ln
- 732 Hillsford Ln
- 1816 Misty Hollow Ln
- 1809 Misty Hollow Ln
- 1810 Misty Hollow Ln
- 826 Green Passage Ln
- 734 Hillsford Ln
- 827 Green Passage Ln
- 730 Hillsford Ln
- 1818 Misty Hollow Ln
- 1903 Misty Water Ct
- 1805 Misty Hollow Ln
- 824 Green Passage Ln
- 728 Hillsford Ln
- 735 Hillsford Ln
- 1905 Misty Water Ct