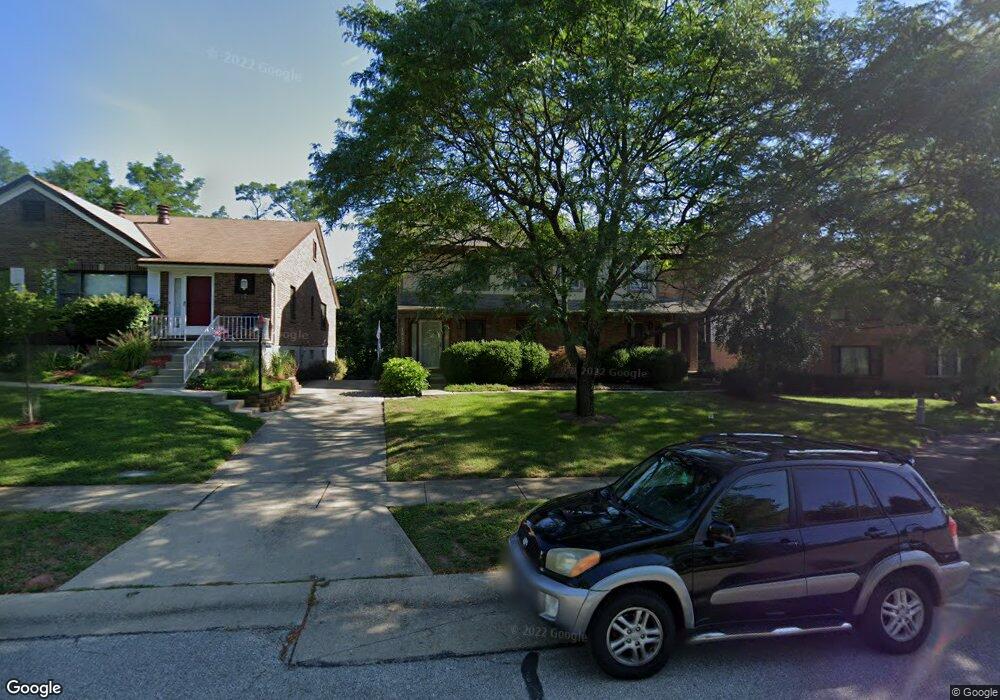
1815 Tuxworth Ave Cincinnati, OH 45238
West Price Hill NeighborhoodEstimated Value: $146,000 - $178,539
3
Beds
3
Baths
1,394
Sq Ft
$113/Sq Ft
Est. Value
About This Home
This home is located at 1815 Tuxworth Ave, Cincinnati, OH 45238 and is currently estimated at $157,885, approximately $113 per square foot. 1815 Tuxworth Ave is a home located in Hamilton County with nearby schools including Carson School, Gilbert A. Dater High School, and Western Hills High School.
Ownership History
Date
Name
Owned For
Owner Type
Purchase Details
Closed on
Dec 9, 2020
Sold by
Robinson Eric and Robinson Eric A
Bought by
Taylor Made Ent Llc
Current Estimated Value
Home Financials for this Owner
Home Financials are based on the most recent Mortgage that was taken out on this home.
Original Mortgage
$120,000
Outstanding Balance
$67,020
Interest Rate
2.7%
Mortgage Type
Future Advance Clause Open End Mortgage
Estimated Equity
$90,865
Purchase Details
Closed on
Jun 26, 2017
Sold by
Meyer Donald J
Bought by
Robinson Eric
Home Financials for this Owner
Home Financials are based on the most recent Mortgage that was taken out on this home.
Original Mortgage
$63,000
Interest Rate
3.94%
Mortgage Type
New Conventional
Purchase Details
Closed on
Mar 26, 1996
Sold by
Fern Sue A
Bought by
Vogelpohl Ruth E
Home Financials for this Owner
Home Financials are based on the most recent Mortgage that was taken out on this home.
Original Mortgage
$28,000
Interest Rate
6.98%
Create a Home Valuation Report for This Property
The Home Valuation Report is an in-depth analysis detailing your home's value as well as a comparison with similar homes in the area
Home Values in the Area
Average Home Value in this Area
Purchase History
| Date | Buyer | Sale Price | Title Company |
|---|---|---|---|
| Taylor Made Ent Llc | -- | None Available | |
| Robinson Eric | $70,000 | None Available | |
| Vogelpohl Ruth E | $74,500 | -- |
Source: Public Records
Mortgage History
| Date | Status | Borrower | Loan Amount |
|---|---|---|---|
| Open | Taylor Made Ent Llc | $120,000 | |
| Previous Owner | Robinson Eric | $63,000 | |
| Previous Owner | Vogelpohl Ruth E | $28,000 |
Source: Public Records
Tax History Compared to Growth
Tax History
| Year | Tax Paid | Tax Assessment Tax Assessment Total Assessment is a certain percentage of the fair market value that is determined by local assessors to be the total taxable value of land and additions on the property. | Land | Improvement |
|---|---|---|---|---|
| 2024 | $2,561 | $40,369 | $7,105 | $33,264 |
| 2023 | $2,562 | $40,369 | $7,105 | $33,264 |
| 2022 | $1,731 | $24,500 | $4,725 | $19,775 |
| 2021 | $1,701 | $24,500 | $4,725 | $19,775 |
| 2020 | $1,655 | $24,500 | $4,725 | $19,775 |
| 2019 | $2,255 | $30,531 | $4,725 | $25,806 |
| 2018 | $2,251 | $30,531 | $4,725 | $25,806 |
| 2017 | $2,244 | $30,531 | $4,725 | $25,806 |
| 2016 | $2,270 | $30,128 | $4,725 | $25,403 |
| 2015 | $1,356 | $30,128 | $4,725 | $25,403 |
| 2014 | $1,367 | $30,128 | $4,725 | $25,403 |
| 2013 | $1,391 | $30,128 | $4,725 | $25,403 |
Source: Public Records
Map
Nearby Homes
- 1803 Ashbrook Dr
- 1774 Ashbrook Dr
- 1861 Ashbrook Dr
- 4764 Clevesdale Dr
- 1869 Ashbrook Dr
- 4769 Hardwick Dr
- 4798 Prosperity Place
- 4826 Prosperity Place
- 4638 Glenway Ave
- 4885 N Overlook Ave
- 1660 Dewey Ave
- 1617 Dewey Ave
- 1646 Dewey Ave
- 4965 Glenway Ave
- 1225 Amanda Place
- 1227 Texas Ave
- 1634 Dewey Ave
- 1226 Rutledge Ave
- 1205 Amanda Place
- 1618 Dewey Ave
- 1815 Tuxworth Ave
- 1815 Tuxworth Ave Unit 12
- 1813 Tuxworth Ave
- 1813 Tuxworth Ave
- 1813 Tuxworth Ave Unit 1
- 1813 Tuxworth Ave Unit 2
- 1813 Tuxworth Ave Unit 10
- 1813 Tuxworth Ave Unit 9
- 1817 Tuxworth Ave Unit 1
- 1817 Tuxworth Ave Unit 14
- 1817 Tuxworth Ave
- 1811 Tuxworth Ave Unit 1
- 1811 Tuxworth Ave Unit 7
- 1811 Tuxworth Ave Unit 8
- 1811 Tuxworth Ave
- 1819 Tuxworth Ave
- 1819 Tuxworth Ave Unit 16
- 1814 Tuxworth Ave Unit 24
- 1814 Tuxworth Ave Unit 23
- 1814 Tuxworth Ave