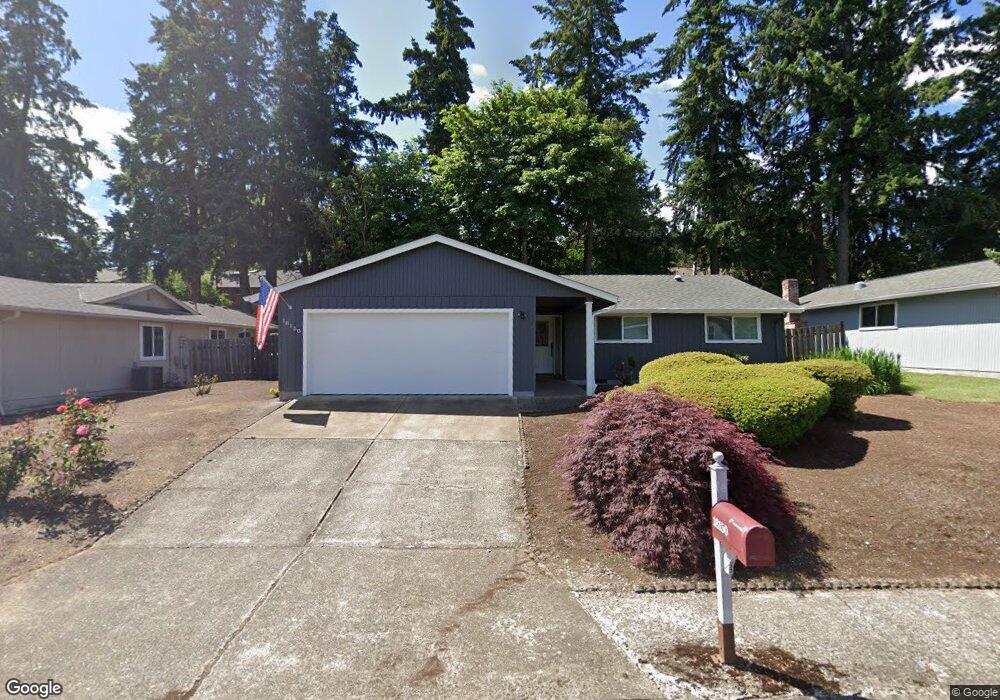
18150 SW Broad Oak Blvd Beaverton, OR 97007
Estimated Value: $464,000 - $498,000
3
Beds
2
Baths
1,270
Sq Ft
$381/Sq Ft
Est. Value
About This Home
This home is located at 18150 SW Broad Oak Blvd, Beaverton, OR 97007 and is currently estimated at $483,750, approximately $380 per square foot. 18150 SW Broad Oak Blvd is a home located in Washington County with nearby schools including Errol Hassell Elementary School, Mountain View Middle School, and Aloha High School.
Ownership History
Date
Name
Owned For
Owner Type
Purchase Details
Closed on
Nov 10, 2021
Sold by
Fernald Leanne K
Bought by
Olson Jeffrey L and Olson Judith A
Current Estimated Value
Home Financials for this Owner
Home Financials are based on the most recent Mortgage that was taken out on this home.
Original Mortgage
$301,000
Outstanding Balance
$230,504
Interest Rate
2.28%
Mortgage Type
New Conventional
Estimated Equity
$253,246
Purchase Details
Closed on
Sep 24, 2021
Sold by
Fernald Leanne K and Billi Odegaard Trust
Bought by
Fernald Leanne K
Home Financials for this Owner
Home Financials are based on the most recent Mortgage that was taken out on this home.
Original Mortgage
$301,000
Outstanding Balance
$230,504
Interest Rate
2.28%
Mortgage Type
New Conventional
Estimated Equity
$253,246
Purchase Details
Closed on
Dec 13, 2012
Sold by
Odegaard Billine Irene
Bought by
Odegaard Billi I and Billi I Odegaard Trust
Create a Home Valuation Report for This Property
The Home Valuation Report is an in-depth analysis detailing your home's value as well as a comparison with similar homes in the area
Home Values in the Area
Average Home Value in this Area
Purchase History
| Date | Buyer | Sale Price | Title Company |
|---|---|---|---|
| Olson Jeffrey L | $459,000 | First American | |
| Fernald Leanne K | -- | None Available | |
| Odegaard Billi I | -- | None Available |
Source: Public Records
Mortgage History
| Date | Status | Borrower | Loan Amount |
|---|---|---|---|
| Open | Olson Jeffrey L | $301,000 |
Source: Public Records
Tax History Compared to Growth
Tax History
| Year | Tax Paid | Tax Assessment Tax Assessment Total Assessment is a certain percentage of the fair market value that is determined by local assessors to be the total taxable value of land and additions on the property. | Land | Improvement |
|---|---|---|---|---|
| 2026 | $4,334 | $243,670 | -- | -- |
| 2025 | $4,334 | $236,580 | -- | -- |
| 2024 | $4,071 | $229,690 | -- | -- |
| 2023 | $4,071 | $223,000 | $0 | $0 |
| 2022 | $3,928 | $223,000 | $0 | $0 |
| 2021 | $3,787 | $210,210 | $0 | $0 |
| 2020 | $3,672 | $204,090 | $0 | $0 |
| 2019 | $3,556 | $198,150 | $0 | $0 |
| 2018 | $3,440 | $192,380 | $0 | $0 |
| 2017 | $3,317 | $186,780 | $0 | $0 |
| 2016 | $3,199 | $181,340 | $0 | $0 |
| 2015 | $3,092 | $176,060 | $0 | $0 |
| 2014 | $3,037 | $170,940 | $0 | $0 |
Source: Public Records
Map
Nearby Homes
- 18047 SW Monte Verdi Blvd
- 18115 SW Broad Oak Blvd
- 18100 SW Barcelona Way
- 18186 SW Strathmoor St
- 18487 SW Bethel Ct
- 6255 SW 182nd Terrace
- 7134 SW 184th Place
- 7380 SW 183rd Place
- 3014 SW 176th Ave
- 2986 SW 176th Ave
- 18365 SW Springfield St
- 7230 SW 189th Ave
- 17226 SW Baker St
- 17277 SW Sugar Plum Ct
- 7115 SW 173rd Ave
- 18902 SW Hazelwood Ln Unit L-13
- 18938 SW Hazelwood Ln Unit L-15
- 19066 SW Strickland Dr
- 17130 SW Baker St
- 18901 SW Northridge Ct Unit Lot 7
- 18120 SW Broad Oak Blvd
- 18180 SW Broad Oak Blvd
- 18145 SW Monte Verdi Blvd
- 18147 SW Monte Verdi Blvd
- 18165 SW Monte Verdi Blvd
- 18107 SW Monte Verdi Blvd
- 18090 SW Broad Oak Blvd
- 18210 SW Broad Oak Blvd
- 18105 SW Monte Verdi Blvd
- 18167 SW Monte Verdi Blvd
- 18125 SW Monte Verdi Blvd
- 18135 SW Broad Oak Blvd
- 18155 SW Broad Oak Blvd
- 18087 SW Monte Verdi Blvd
- 18127 SW Monte Verdi Blvd
- 18215 SW Monte Verdi Blvd
- 18205 SW Broad Oak Blvd
- 18060 SW Broad Oak Blvd
- 18085 SW Monte Verdi Blvd
- 18217 SW Monte Verdi Blvd