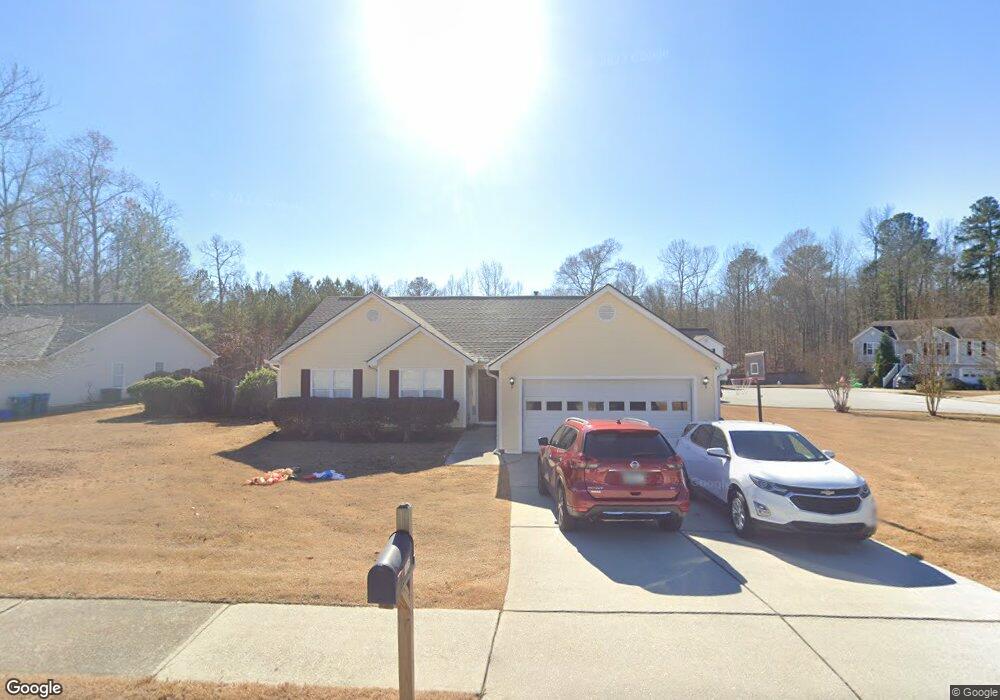
1816 Fort Connors Ct Unit 3B Dacula, GA 30019
Estimated Value: $322,000 - $357,000
3
Beds
2
Baths
1,595
Sq Ft
$213/Sq Ft
Est. Value
About This Home
This home is located at 1816 Fort Connors Ct Unit 3B, Dacula, GA 30019 and is currently estimated at $339,369, approximately $212 per square foot. 1816 Fort Connors Ct Unit 3B is a home located in Gwinnett County with nearby schools including Fort Daniel Elementary School, Frank N. Osborne Middle School, and Mill Creek High School.
Ownership History
Date
Name
Owned For
Owner Type
Purchase Details
Closed on
Jun 17, 2022
Sold by
Clay Ventures Llc
Bought by
Yancey Richard and Robinson Megan
Current Estimated Value
Home Financials for this Owner
Home Financials are based on the most recent Mortgage that was taken out on this home.
Original Mortgage
$255,290
Outstanding Balance
$242,436
Interest Rate
5.37%
Mortgage Type
FHA
Estimated Equity
$96,933
Purchase Details
Closed on
Aug 25, 2011
Sold by
Branch Banking Co
Bought by
Clay Ventures Llc
Purchase Details
Closed on
Sep 7, 2010
Sold by
Higgins Josh and Higgins Nicole M
Bought by
Branch Bkng & Trust Co
Purchase Details
Closed on
May 10, 2001
Sold by
Crown Park Hms/Appalachee Llc
Bought by
Higgins Joshua J and Higgins Nicole M
Create a Home Valuation Report for This Property
The Home Valuation Report is an in-depth analysis detailing your home's value as well as a comparison with similar homes in the area
Home Values in the Area
Average Home Value in this Area
Purchase History
| Date | Buyer | Sale Price | Title Company |
|---|---|---|---|
| Yancey Richard | $260,000 | -- | |
| Yancey Richard | $260,000 | -- | |
| Clay Ventures Llc | $65,000 | -- | |
| Clay Ventures Llc | $65,000 | -- | |
| Branch Bkng & Trust Co | $97,750 | -- | |
| Branch Bkng & Trust Co | $97,750 | -- | |
| Higgins Joshua J | $122,600 | -- | |
| Higgins Joshua J | $122,600 | -- |
Source: Public Records
Mortgage History
| Date | Status | Borrower | Loan Amount |
|---|---|---|---|
| Open | Yancey Richard | $255,290 |
Source: Public Records
Tax History Compared to Growth
Tax History
| Year | Tax Paid | Tax Assessment Tax Assessment Total Assessment is a certain percentage of the fair market value that is determined by local assessors to be the total taxable value of land and additions on the property. | Land | Improvement |
|---|---|---|---|---|
| 2025 | $4,553 | $136,880 | $36,080 | $100,800 |
| 2024 | $4,475 | $126,880 | $29,600 | $97,280 |
| 2023 | $4,475 | $104,000 | $29,600 | $74,400 |
| 2022 | $4,307 | $110,080 | $24,800 | $85,280 |
| 2021 | $3,446 | $84,840 | $18,640 | $66,200 |
| 2020 | $3,031 | $72,920 | $17,120 | $55,800 |
| 2019 | $2,490 | $72,920 | $17,120 | $55,800 |
| 2018 | $2,746 | $68,000 | $15,600 | $52,400 |
| 2016 | $2,468 | $59,560 | $12,400 | $47,160 |
| 2015 | $2,266 | $53,240 | $10,400 | $42,840 |
| 2014 | $2,084 | $47,840 | $10,400 | $37,440 |
Source: Public Records
Map
Nearby Homes
- 2425 Fort Daniels Dr Unit 3A
- 1603 Fort Perry Way
- 1655 Brisbane Dr
- 2416 Moultrie Ct
- 1720 Fort Daniels Trail
- 1827 Scouts Walk
- 2431 Lance Ridge Way
- 2706 Captain Ct
- 1573 Vinings Ct
- 2765 Daniel Park Run Unit 3
- 2628 Adair Trail
- 2439 Canter Brook Ct Unit 1
- 2687 High Creek Run
- 1618 Rocky Knoll Ln
- 2674 Rocky Knoll Ct
- 1505 Heatherton Rd Unit 4
- 1717 Willoughby Dr
- 2717 High Creek Run Unit 1
- 1816 Fort Connors Ct
- 1816 Fort Connors Ct
- 1637 Fort Connors Way
- 0 Fort Connors Ct Unit 7452608
- 0 Fort Connors Ct Unit 7276697
- 1806 Fort Connors Ct
- 1617 Fort Connors Way
- 1817 Fort Connors Ct
- 1807 Fort Connors Ct
- 1796 Fort Connors Ct
- 1638 Fort Connors Way
- 1608 Fort Connors Way
- 1628 Fort Connors Way
- 1648 Fort Connors Way
- 1648 Fort Connors Way Unit FORT CONNORS WAY
- 0 Fort Connors Way
- 1618 Fort Connors Way
- 1658 Fort Connors Way Unit 3B
- 1624 Fort Perry Way
- 1734 Fort River Way Unit B