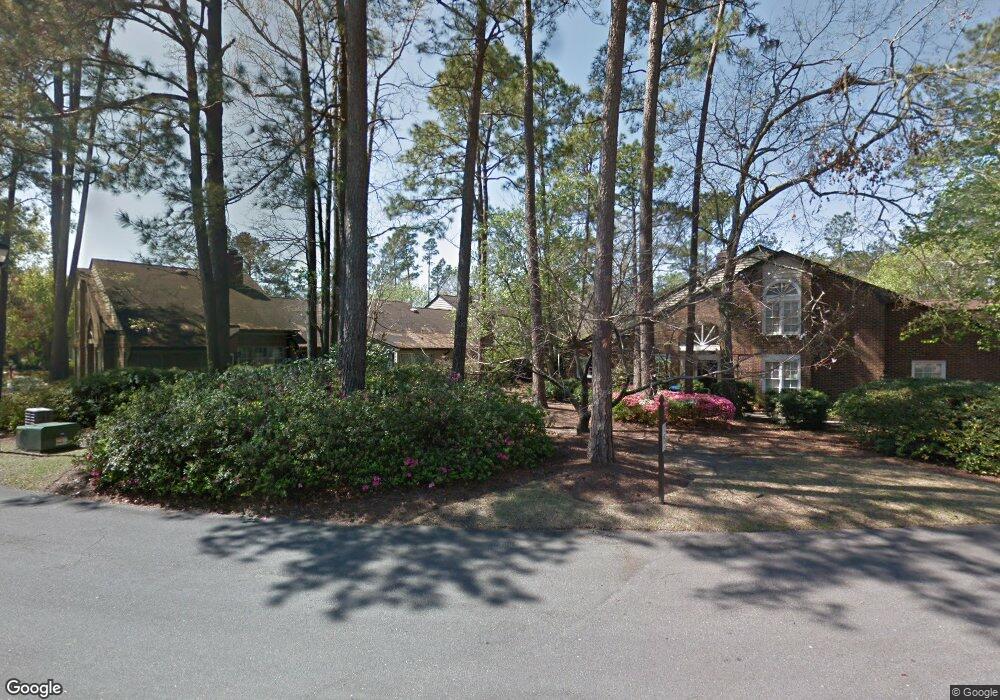
1816 Jumpin Run Wilmington, NC 28403
Glen Meade NeighborhoodEstimated Value: $348,000 - $394,074
3
Beds
3
Baths
1,928
Sq Ft
$193/Sq Ft
Est. Value
About This Home
This home is located at 1816 Jumpin Run, Wilmington, NC 28403 and is currently estimated at $372,519, approximately $193 per square foot. 1816 Jumpin Run is a home located in New Hanover County with nearby schools including Edwin A. Alderman Elementary School, Williston Middle School, and New Hanover High School.
Ownership History
Date
Name
Owned For
Owner Type
Purchase Details
Closed on
Dec 30, 2022
Sold by
Marin Living Trust
Bought by
Bullings Kathryn M
Current Estimated Value
Purchase Details
Closed on
Nov 24, 2021
Sold by
Doherty Daniel T and Doherty Karen A
Bought by
Marin Anthony and Marin Mercedes
Purchase Details
Closed on
Nov 9, 2004
Sold by
Wallace James E Sr Lois L
Bought by
Doherty Daniel T Karen A
Purchase Details
Closed on
Dec 16, 1997
Sold by
Wallace James Sr E Lois L
Bought by
Wallace James E
Purchase Details
Closed on
May 1, 1987
Sold by
Wallace James E Lois L
Bought by
Wallace James E Lois L
Purchase Details
Closed on
Oct 1, 1985
Sold by
17Th East Development Corp
Bought by
Wallace James E Lois L
Purchase Details
Closed on
Jun 1, 1984
Bought by
17Th East Development Corp
Create a Home Valuation Report for This Property
The Home Valuation Report is an in-depth analysis detailing your home's value as well as a comparison with similar homes in the area
Home Values in the Area
Average Home Value in this Area
Purchase History
| Date | Buyer | Sale Price | Title Company |
|---|---|---|---|
| Bullings Kathryn M | $335,000 | -- | |
| Marin Anthony | $265,000 | None Available | |
| Doherty Daniel T Karen A | $175,000 | -- | |
| Wallace James E | -- | -- | |
| Wallace James E Lois L | -- | -- | |
| Wallace James E Lois L | $85,500 | -- | |
| 17Th East Development Corp | $510,000 | -- |
Source: Public Records
Tax History Compared to Growth
Tax History
| Year | Tax Paid | Tax Assessment Tax Assessment Total Assessment is a certain percentage of the fair market value that is determined by local assessors to be the total taxable value of land and additions on the property. | Land | Improvement |
|---|---|---|---|---|
| 2025 | $2,405 | $408,700 | $75,000 | $333,700 |
| 2023 | $2,037 | $234,100 | $75,000 | $159,100 |
| 2022 | $1,990 | $234,100 | $75,000 | $159,100 |
| 2021 | $2,003 | $234,100 | $75,000 | $159,100 |
| 2020 | $1,922 | $182,500 | $30,000 | $152,500 |
| 2019 | $1,922 | $182,500 | $30,000 | $152,500 |
| 2018 | $1,922 | $182,500 | $30,000 | $152,500 |
| 2017 | $1,922 | $182,500 | $30,000 | $152,500 |
| 2016 | $1,930 | $174,200 | $20,000 | $154,200 |
| 2015 | $1,845 | $174,200 | $20,000 | $154,200 |
| 2014 | $1,766 | $174,200 | $20,000 | $154,200 |
Source: Public Records
Map
Nearby Homes
- 1916 Jumpin Run Dr
- 2018 Jumpin Run Dr
- 1920 Hillsboro Rd
- 254 Longhill Dr
- 2110 Wisteria Dr
- 2109 E Lake Shore Dr
- 1802 S Churchill Dr
- 1946 S Live Oak Pkwy
- 814 Woodlawn Ave
- 1299 Wellington Ave
- 2507 Flint Dr
- 2610 Oleander Dr
- 2940 Oleander Dr Unit G6
- 2940 Oleander Dr Unit A5
- 2940 Oleander Dr Unit F11
- 2940 Oleander Dr Unit D16
- 606 Ivey Cir
- 1326 Country Club Rd
- 3801 Gillette Dr
- 1884 W Lake Shore Dr
- 1816 Jumpin Run Dr
- 1816 Jumpin Run Dr Unit 5
- 1814 Jumpin Run
- 1814 Jumpin Run Dr Unit 6
- 1812 Jumpin Run Dr
- 1812 Jumpin Run
- 1810 Jumpin Run Unit 8
- 1808 Jumpin Run
- 1808 Jumpin Run Unit 4
- 1810 Jumpin Run Dr
- 1810 Jumpin Run Dr Unit 8
- 1802 Jumpin Run Unit 1
- 1806 Jumpin Run Unit 3
- 1806 Jumpin Run Dr
- 1806 Jumpin Run Dr Unit 3
- 1804 Jumpin Run
- 1902 Jumpin Run Dr
- 1902 Jumpin Run Dr Unit 9
- 1902 Jumpin Run
- 1904 Jumpin Run