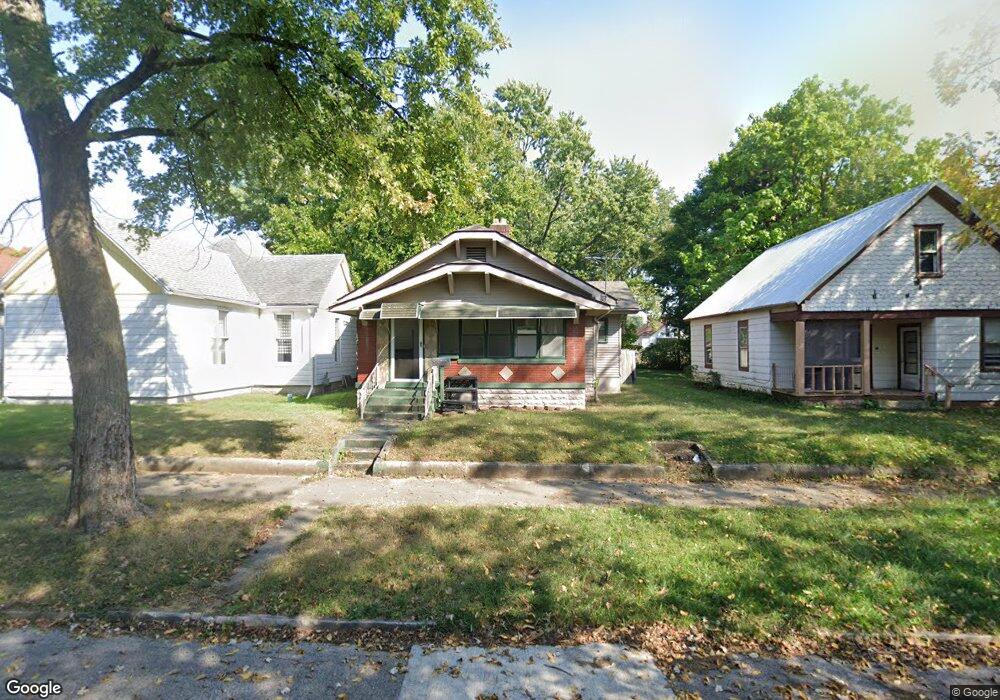
1816 S 8th St Terre Haute, IN 47802
Southland-Sarah Scott NeighborhoodEstimated Value: $84,000 - $108,000
2
Beds
1
Bath
1,268
Sq Ft
$76/Sq Ft
Est. Value
About This Home
This home is located at 1816 S 8th St, Terre Haute, IN 47802 and is currently estimated at $96,830, approximately $76 per square foot. 1816 S 8th St is a home located in Vigo County with nearby schools including Farrington Grove Elementary School, Sarah Scott Middle School, and Terre Haute South Vigo High School.
Ownership History
Date
Name
Owned For
Owner Type
Purchase Details
Closed on
Sep 17, 2024
Sold by
House Dr Llc By Sally R Fagg Managing Me
Bought by
F & F Property Holdiings Llc By Justin F
Current Estimated Value
Purchase Details
Closed on
Feb 11, 2013
Sold by
The Secretary Of Veterans Affairs
Bought by
House Dr Llc
Purchase Details
Closed on
May 24, 2012
Sold by
Fifth Third Mortgage Co
Bought by
Secretary Of Veterans Affairs
Purchase Details
Closed on
May 17, 2012
Sold by
Shattuck Miranda D and Durham Miranda D
Bought by
Fifth Third Mortgage Co
Purchase Details
Closed on
Sep 26, 2008
Sold by
Archer Ralph and Archer Vicki
Bought by
Durham Miranda D
Home Financials for this Owner
Home Financials are based on the most recent Mortgage that was taken out on this home.
Original Mortgage
$74,900
Interest Rate
6.57%
Mortgage Type
VA
Create a Home Valuation Report for This Property
The Home Valuation Report is an in-depth analysis detailing your home's value as well as a comparison with similar homes in the area
Home Values in the Area
Average Home Value in this Area
Purchase History
| Date | Buyer | Sale Price | Title Company |
|---|---|---|---|
| F & F Property Holdiings Llc By Justin F | $40,500 | Aames Title & Closing Llc | |
| House Dr Llc | -- | Integrity Title Services | |
| Secretary Of Veterans Affairs | -- | None Available | |
| Fifth Third Mortgage Co | $51,997 | None Available | |
| Durham Miranda D | -- | -- |
Source: Public Records
Mortgage History
| Date | Status | Borrower | Loan Amount |
|---|---|---|---|
| Previous Owner | Durham Miranda D | $74,900 |
Source: Public Records
Tax History Compared to Growth
Tax History
| Year | Tax Paid | Tax Assessment Tax Assessment Total Assessment is a certain percentage of the fair market value that is determined by local assessors to be the total taxable value of land and additions on the property. | Land | Improvement |
|---|---|---|---|---|
| 2024 | $1,101 | $50,900 | $4,400 | $46,500 |
| 2023 | $1,102 | $50,700 | $5,200 | $45,500 |
| 2022 | $1,102 | $50,700 | $5,000 | $45,700 |
| 2021 | $1,101 | $50,700 | $5,100 | $45,600 |
| 2020 | $1,101 | $50,700 | $5,100 | $45,600 |
| 2019 | $1,100 | $50,700 | $5,100 | $45,600 |
| 2018 | $1,439 | $47,700 | $4,800 | $42,900 |
| 2017 | $937 | $46,600 | $4,800 | $41,800 |
| 2016 | $949 | $47,200 | $4,900 | $42,300 |
| 2014 | $1,225 | $60,900 | $6,500 | $54,400 |
| 2013 | $1,225 | $59,600 | $6,300 | $53,300 |
Source: Public Records
Map
Nearby Homes