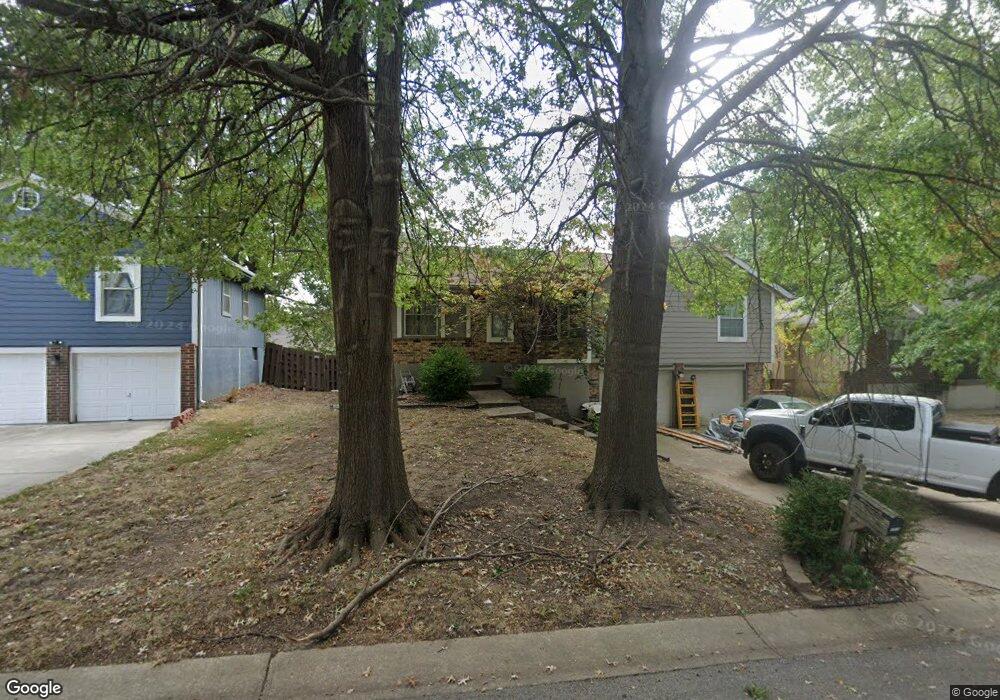
1816 SW West View Cir Blue Springs, MO 64015
Estimated Value: $261,044 - $320,000
3
Beds
2
Baths
1,287
Sq Ft
$232/Sq Ft
Est. Value
About This Home
This home is located at 1816 SW West View Cir, Blue Springs, MO 64015 and is currently estimated at $298,511, approximately $231 per square foot. 1816 SW West View Cir is a home located in Jackson County with nearby schools including Franklin Smith Elementary School, Moreland Ridge Middle School, and Blue Springs South High School.
Ownership History
Date
Name
Owned For
Owner Type
Purchase Details
Closed on
Mar 28, 2008
Sold by
Wilke Jeffrey L and Wilke Sheila
Bought by
Bradley Joshua C
Current Estimated Value
Home Financials for this Owner
Home Financials are based on the most recent Mortgage that was taken out on this home.
Original Mortgage
$132,300
Outstanding Balance
$82,332
Interest Rate
5.72%
Mortgage Type
Purchase Money Mortgage
Estimated Equity
$216,179
Purchase Details
Closed on
May 31, 2007
Sold by
Beachner James G and Beachner Taffany A
Bought by
Wilke Jeffrey L and Wilke Sheila
Purchase Details
Closed on
Apr 27, 1998
Sold by
White Jeff P and White Vicki L
Bought by
Beachner James G and Beachner Taffany A
Home Financials for this Owner
Home Financials are based on the most recent Mortgage that was taken out on this home.
Original Mortgage
$91,200
Interest Rate
7.09%
Mortgage Type
Purchase Money Mortgage
Create a Home Valuation Report for This Property
The Home Valuation Report is an in-depth analysis detailing your home's value as well as a comparison with similar homes in the area
Home Values in the Area
Average Home Value in this Area
Purchase History
| Date | Buyer | Sale Price | Title Company |
|---|---|---|---|
| Bradley Joshua C | -- | Coffelt Land Title Inc | |
| Wilke Jeffrey L | -- | Kansas City Title | |
| Beachner James G | -- | Stewart Title |
Source: Public Records
Mortgage History
| Date | Status | Borrower | Loan Amount |
|---|---|---|---|
| Open | Bradley Joshua C | $132,300 | |
| Previous Owner | Beachner James G | $91,200 |
Source: Public Records
Tax History Compared to Growth
Tax History
| Year | Tax Paid | Tax Assessment Tax Assessment Total Assessment is a certain percentage of the fair market value that is determined by local assessors to be the total taxable value of land and additions on the property. | Land | Improvement |
|---|---|---|---|---|
| 2025 | $2,313 | $32,608 | $5,934 | $26,674 |
| 2024 | $2,269 | $28,356 | $3,241 | $25,115 |
| 2023 | $2,269 | $28,356 | $3,658 | $24,698 |
| 2022 | $2,477 | $27,360 | $3,857 | $23,503 |
| 2021 | $2,475 | $27,360 | $3,857 | $23,503 |
| 2020 | $2,321 | $26,097 | $3,857 | $22,240 |
| 2019 | $2,244 | $26,097 | $3,857 | $22,240 |
| 2018 | $2,136 | $23,917 | $3,081 | $20,836 |
| 2017 | $2,136 | $23,917 | $3,081 | $20,836 |
| 2016 | $2,111 | $23,699 | $3,914 | $19,785 |
| 2014 | $2,056 | $23,009 | $3,800 | $19,209 |
Source: Public Records
Map
Nearby Homes
- 1604 SW 21st St
- 1331 SW Horizon Dr
- 1604 SW 18th Street Ct
- 1008 SW 17th St
- 1804 SW Cherokee Strip
- 1001 SW 18th St
- 1201 SW Hopi St
- 1900 SW Cherokee Strip
- 1104 SW Mic-O-say Dr
- 1004 SW Twilight Ln
- 1504 SW Sunset St
- 1311 SW 25th St
- 1005 SW 23rd St
- 1004 SW Hiawatha Dr
- 1718 SW 24th St
- 1203 SW 26th St
- 2413 SW Emerald Creek Place
- 1103 SW Stonecreek Dr
- 2603 SW Shadow Creek Ct
- 701 SW 17th St
- 1812 SW West View Cir
- 1820 SW West View Cir
- 1808 SW West View Cir
- 1821 SW West View Cir
- 1817 SW West View Cir
- 1813 SW West View Cir
- 1804 SW West View Cir
- 1809 SW West View Cir
- 1407 SW 19th St
- 1800 SW West View Cir
- 1403 SW 19th St
- 1401 SW 19th St
- 1411 SW 19th St
- 1700 SW Clark Rd
- 1415 SW 19th St
- 1821 SW Wigwam Place
- 1325 SW 19th St
- 1817 SW Wigwam Place
- 1823 SW Wigwam Place
- 1813 SW Wigwam Place